The most important person reading this may be non-technical. While technical expertise is critical to accomplish the goals set out below, much of the initial work done will be “imagination work”, trying to figure out how we as a community want to work with, in, and around a new form of access into Helium.
Let’s start with laying out how the system works, from the sensor sending out a packet all the way until you see that information displayed on a screen.

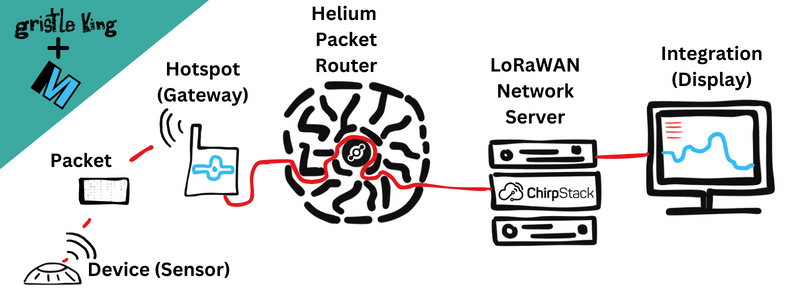
The sensor emits a packet, the packet is received by a Helium Hotspot (also known as a “gateway”), that Hotspot sends it to the Helium Packet Router. The Helium Packet Router figures out which LNS to route the packet to and sends it there. At the LNS the packet is received and decoded, then sent out to an Integration, usually to be displayed in a dashboard or sometimes as an alert or notification. Whew!
Now, currently that “LoRaWAN Network Server” can be either the Helium Foundation Console, or, as in the image, a Chirpstack Console. Either one is considered an LNS.
This flow is different than a “normal” LoRaWAN network because of the addition of the Helium Packet Router. Now, the HPR is required for this whole thing to work; it coordinates the 400,000 Hotspots across the world. No other LoRaWAN out there has anything close to this amount of Hotspots, so they don’t have this problem.
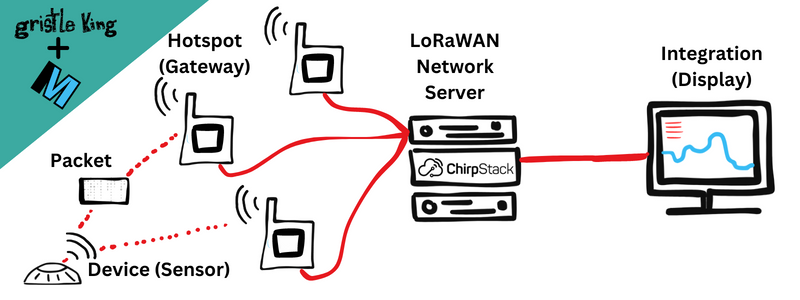
In fact, a typical LoRaWAN deployment might have just 2 or 3 Hotspots (they’d call ’em Gateways) and would look like this:

So the big difference is REALLY big: 2 or 3 (or maybe 2–3 dozen) Hotspot/Gateways versus 400,000! That’s why at Helium we need the HPR.
Ok, so here’s the rub (well, one of a few rubs). Chirpstack wasn’t built for a network like Helium. The way it displays information to the LNS owner is based on the idea that an LNS will maybe 3 dozen gateways.
By the way, if you want to see and use an actual Chirpstack instance on Helium, please check out the MeteoScientific Chirpstack Console, which I’m running to help normal people use this fancy technology. It’s free to sign up for an account, and you get a couple hundred DC when you do, which is enough to add your first sensor to the network and see how it works for yourself.
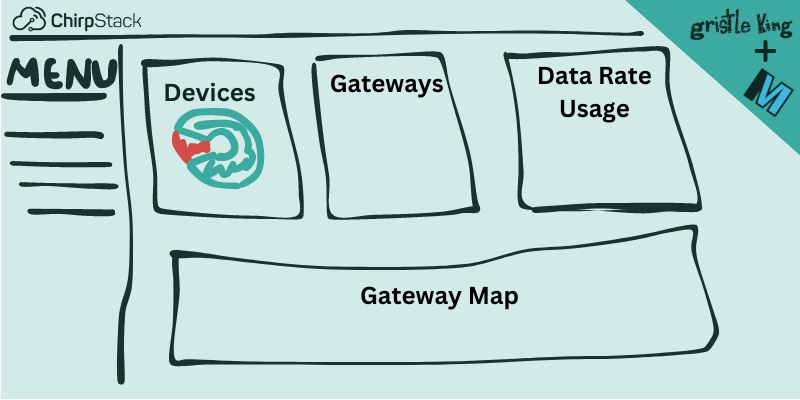
When you first sign into the Chirpstack Console, this is what you see:

That’s fantastic if you only have a handful of gateways and you’re really focused on Device Data Rate, but…that ain’t us, which means that out of the 4 displays (Device, Gateways, Data Rate Usage, and Gateway Map) we only see 2, and really, only 1 of those is useful to most of us.
So, what should we do?
Since Chirpstack is open source (you can read all about it here and check out their Github account here), I think we build a better option. This is either a commercial opportunity (you design a dashboard and sell access to it) or something that the Helium Foundation would be delighted to see a grant application for.
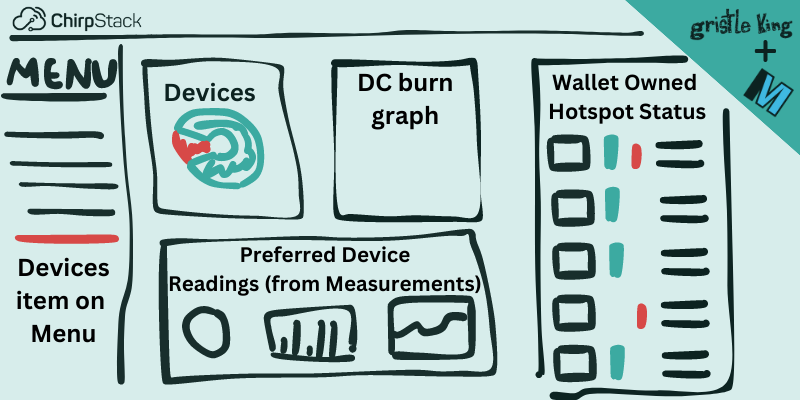
As a general thing to start with, I’d like to see something like this, where the LNS owner gets to see data about the fleet of Hotspots & Devices they’re running.

Now, that probably won’t be what it ends up with, and I’d love to hear what YOU would want to see! It might be cool to see most recent device onboarded, or a per device DC burn window, or an alert for any device that goes out of some pre-set parameters.
Whatever it is, I’m looking forward to seeing who is going to build what. It is entirely possible I’ll have one built for the MeteoScientific Console just to see how it works, so consider me in the running for helping improve this. Now, this’ll work best if we all put our shoulders to the wheel together, so if there is anything I can do to help you along the way, please reach out, I’d love to collab on this and improve the system for everyone.
Rock on!

Leave a Reply