After I did the statistics video with Matthew Patrick, I heard from @cryptofulness via Twitter. He reached out from Portugal to offer some help with a “t‑test implementation” to test some Hotspots. If you remember, a “t‑test” compares two sets of data and tells you whether or not there’s actually a meaningful result.
In this case, the two sets of data are your hotspot’s earnings and the global average. I’m going to walk you through how to use the tool Cryptofulness set up for me, and you can see for yourself if your Hotspot is REALLY doing better (or worse!) than the average, and by how much.
For reference (and yes, this counts as bragging), Amateur Jade Hare, which is a hotspot I have set up on a mountain in San Diego, has performed 612% above the Network average over the last 3 months. By the way, it’s running a 3 dBi antenna. As I’ve said before, when it comes to earnings, antennas don’t really matter. You could use an HNTenna (what I’ve got), or any of the McGill antennas, or a PPL antenna. On the PPL, use code GRISTLEKING for 5% off. Remember though, location is what drives earnings, NOT the antenna.
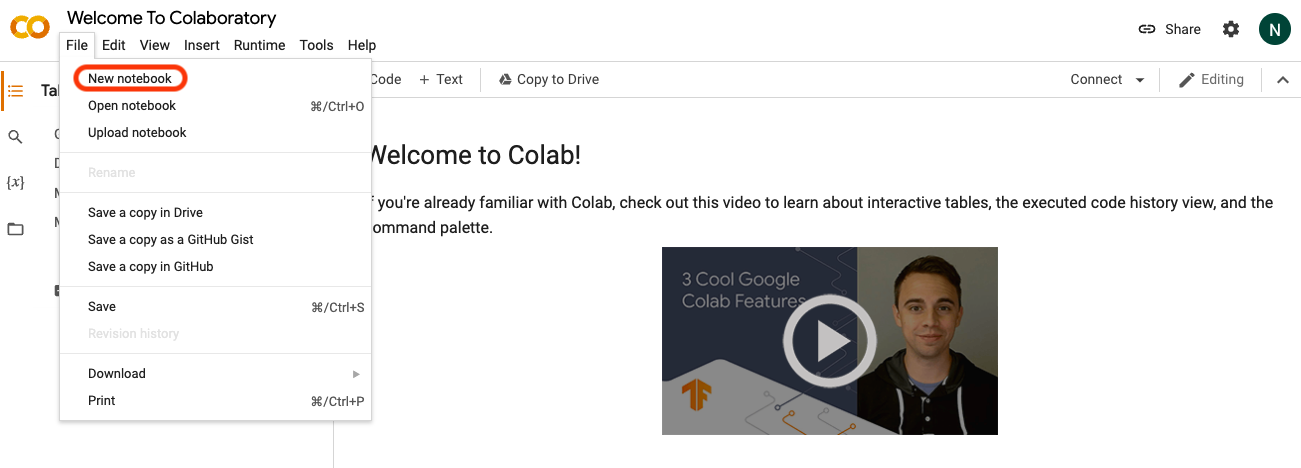
Ok, let’s go! You’ll need to sign in to a Google account, then open up a Google Colaboratory tab at this link:
https://colab.research.google.com/
Choose “New Notebook”.

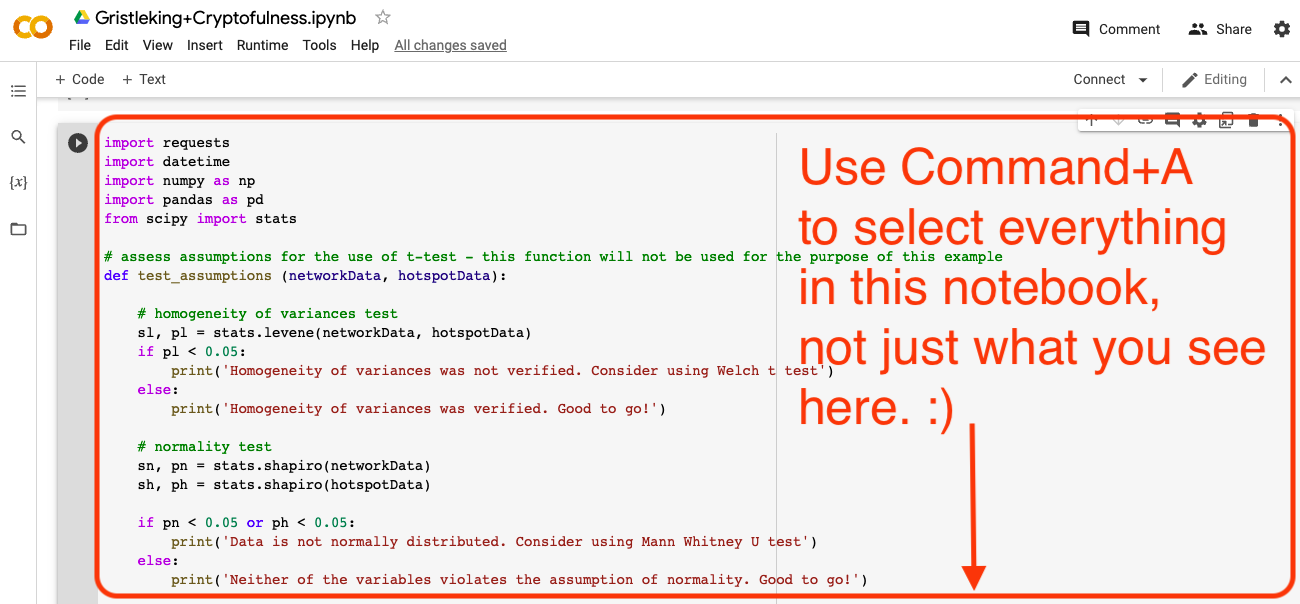
Now, open the Gristleking+Cryptofulness notebook in another tab, and copy ALL of the code in there from mine to yours. Be sure to get each of the different “cells”, marked by the Play circle/triangle in the left grey column.

You’re doing this in your own notebook so that you can look at your hotspot without the entire world seeing what you’re doing (which is what will happen if you run the code in my notebook.)

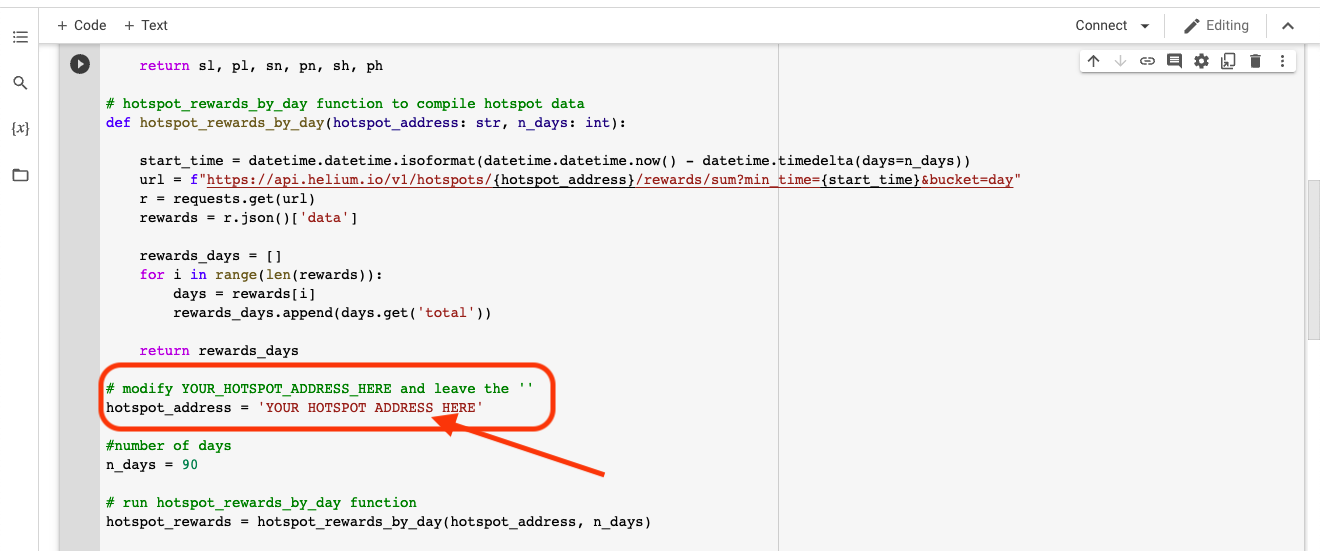
Ok, one more step to get to the results. With the code pasted in to your snazzy new notebook, scroll down until you see the green line saying # modify YOUR HOTSPOT ADDRESS HERE and the leave the ' '

I’ll use Amateur Jade Hare’s address for the demo. AJH’s address is: 112qN5DMoTdc4ThFGQHKyg4e3QfuEkkCUEfu5EgZA1QZLNdqb4Cf, which you can see below.
Once you’ve filled in your Hotspot address, hit the “play” button.

It’ll spin and dance for a bit, then spit out your result. In this case:
A two sample t-test was performed to compare your hotspot rewards for the last 90 days and the network rewards for the same period. The difference between the two means is statistically significant and your hotspot was above the network average for: 612 %
Your hotspot daily average (HNT): 0.794
Helium network daily average (HNT): 0.112
Now, how do you know HOW statistically significant this is? Keep rolling down that file and hitting the little Play button on each one of the four cells. I’ma drop a video in here so you can see what that looks like.
Ok, so what does each of those mean? Oh, in the video I should probably have called them “blocks”, not “cells”. My bad. 🙂
Block 1: The t‑test. This compares your Hotspot’s rewards against all active Hotspots on the Network rewards and tells you if the difference is real or just “noise”.
Block 2: Shows the rewards by day for the Network and your Hotspot for the last 90 days. The orange line highlights the data pattern.
Block 3: A Pearson correlation, tests the association between your Hotspot and the Network. For example, if the Network sucks, is your Hotspot also sucking? That does NOT imply the Network sucking is the cause, just that they seem to follow the same pattern.
Block 4: A simple linear relationship between the Network and the Hotspots reward exploring “causality”. This is sort of like block 3, expect where block 3 says “Yeah, these 2 things go in the same direction”, block 4 says “When the Network goes down on average, it causes your Hotspot to also go down on average.” In my case, the effect is amplified: For every increase in Network HNT of 1, AJH rewards go up 6.8.
So, that’s it. Any mistakes in this or in the interpretation are mine, so I explained something incorrectly, lemme know! Also let me know what you find out about your Hotspot, and if you liked this, give @cryptofulness a follow on Twitter!
If you want to join a rad group exploring Helium and how to stay ahead of the curve, consider joining the Gristle Crüe. We Zoom every Tuesday at 10 AM Pacific and talk about the latest in how to crush it with Helium. Rock on!

Leave a Reply