The constant question with Helium is, “How much will my hotspot earn?” While I’ve covered the strategy for maximizing that in other posts, it sure is nice when you have a tool that helps dial in your accuracy. HotspotRF aims to be one of those tools, and when it first came out I sat down with the owner, Aidan Curry, to walk through how to use it. That interview is at the bottom of this post, but I thought I’d check in on the tool and see what’s new. As it turns out, a TON!
Like Helium.Vision (walkthrough here), HotspotRF’s main offering is RF (for Radio Frequency) simulation.
Let’s say you just moved to Vegas, up in the nice part of town just north west of Summerlin. You want to know if putting a 21′ pole on top of your two story house will help pay the mortgage, right?
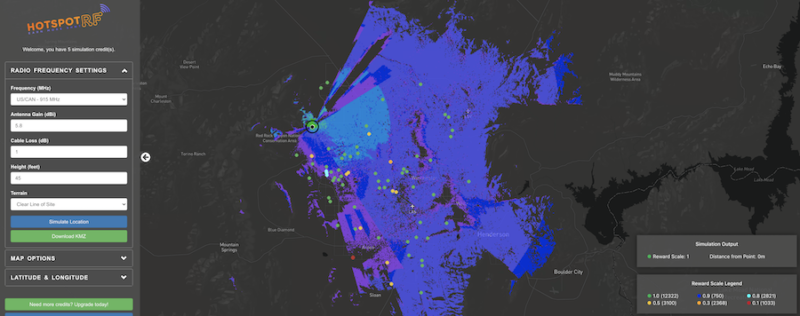
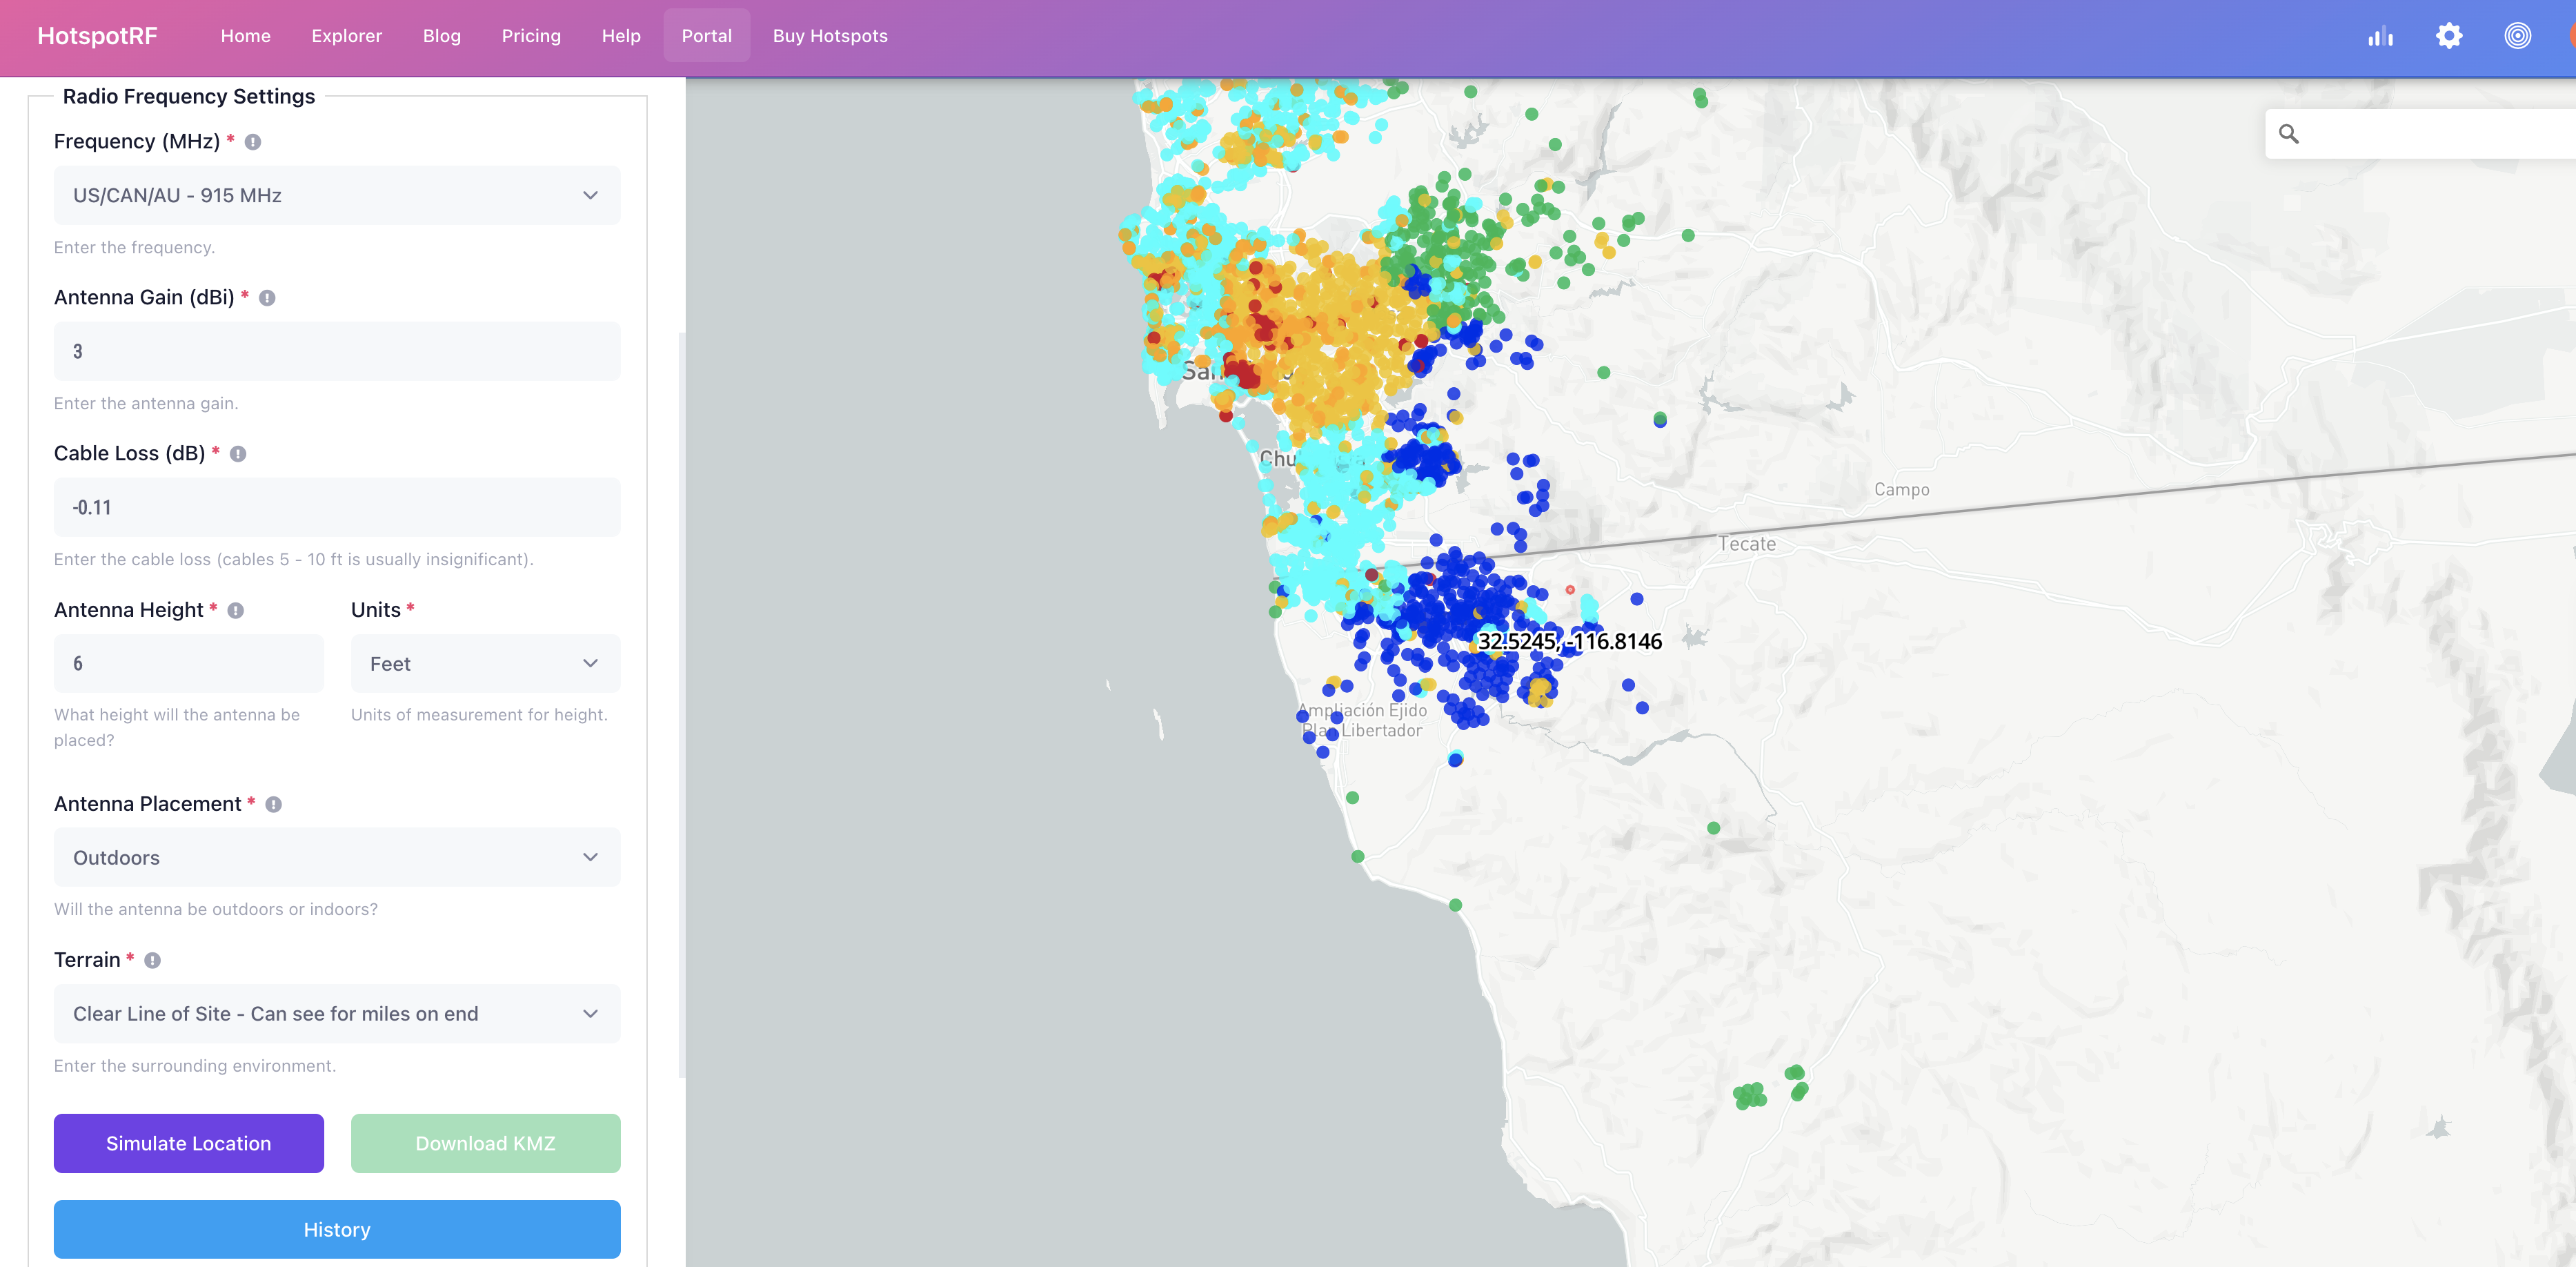
One of the best ways to see if your location *might* work is to run an RF simulation to see how far those little LoRa packets will fly. You plug in some details, like your specific frequency (915 for us North American types), antenna gain, cable loss, height of antenna, and type of terrain, and HotspotRF will spit out an image of what your radio coverage should look like.
Now, you’ve got to sign up first, so even though you get free credits, you’ll need to pay for a plan in order to get full value. For a test run, I picked a place just south of the US border. The greater Tijuana area has been rocking lately, and I’ve been eyeing some of those mountain placements. So, I picked a promising looking spot, dropped a pin, and hit the “Simulate Location” button.
Sims take a while to run on any platform, whether it’s HeliumVision, Hotspotty, or HotspotRF. You’re asking for an extraordinary amount of information to be crunched.
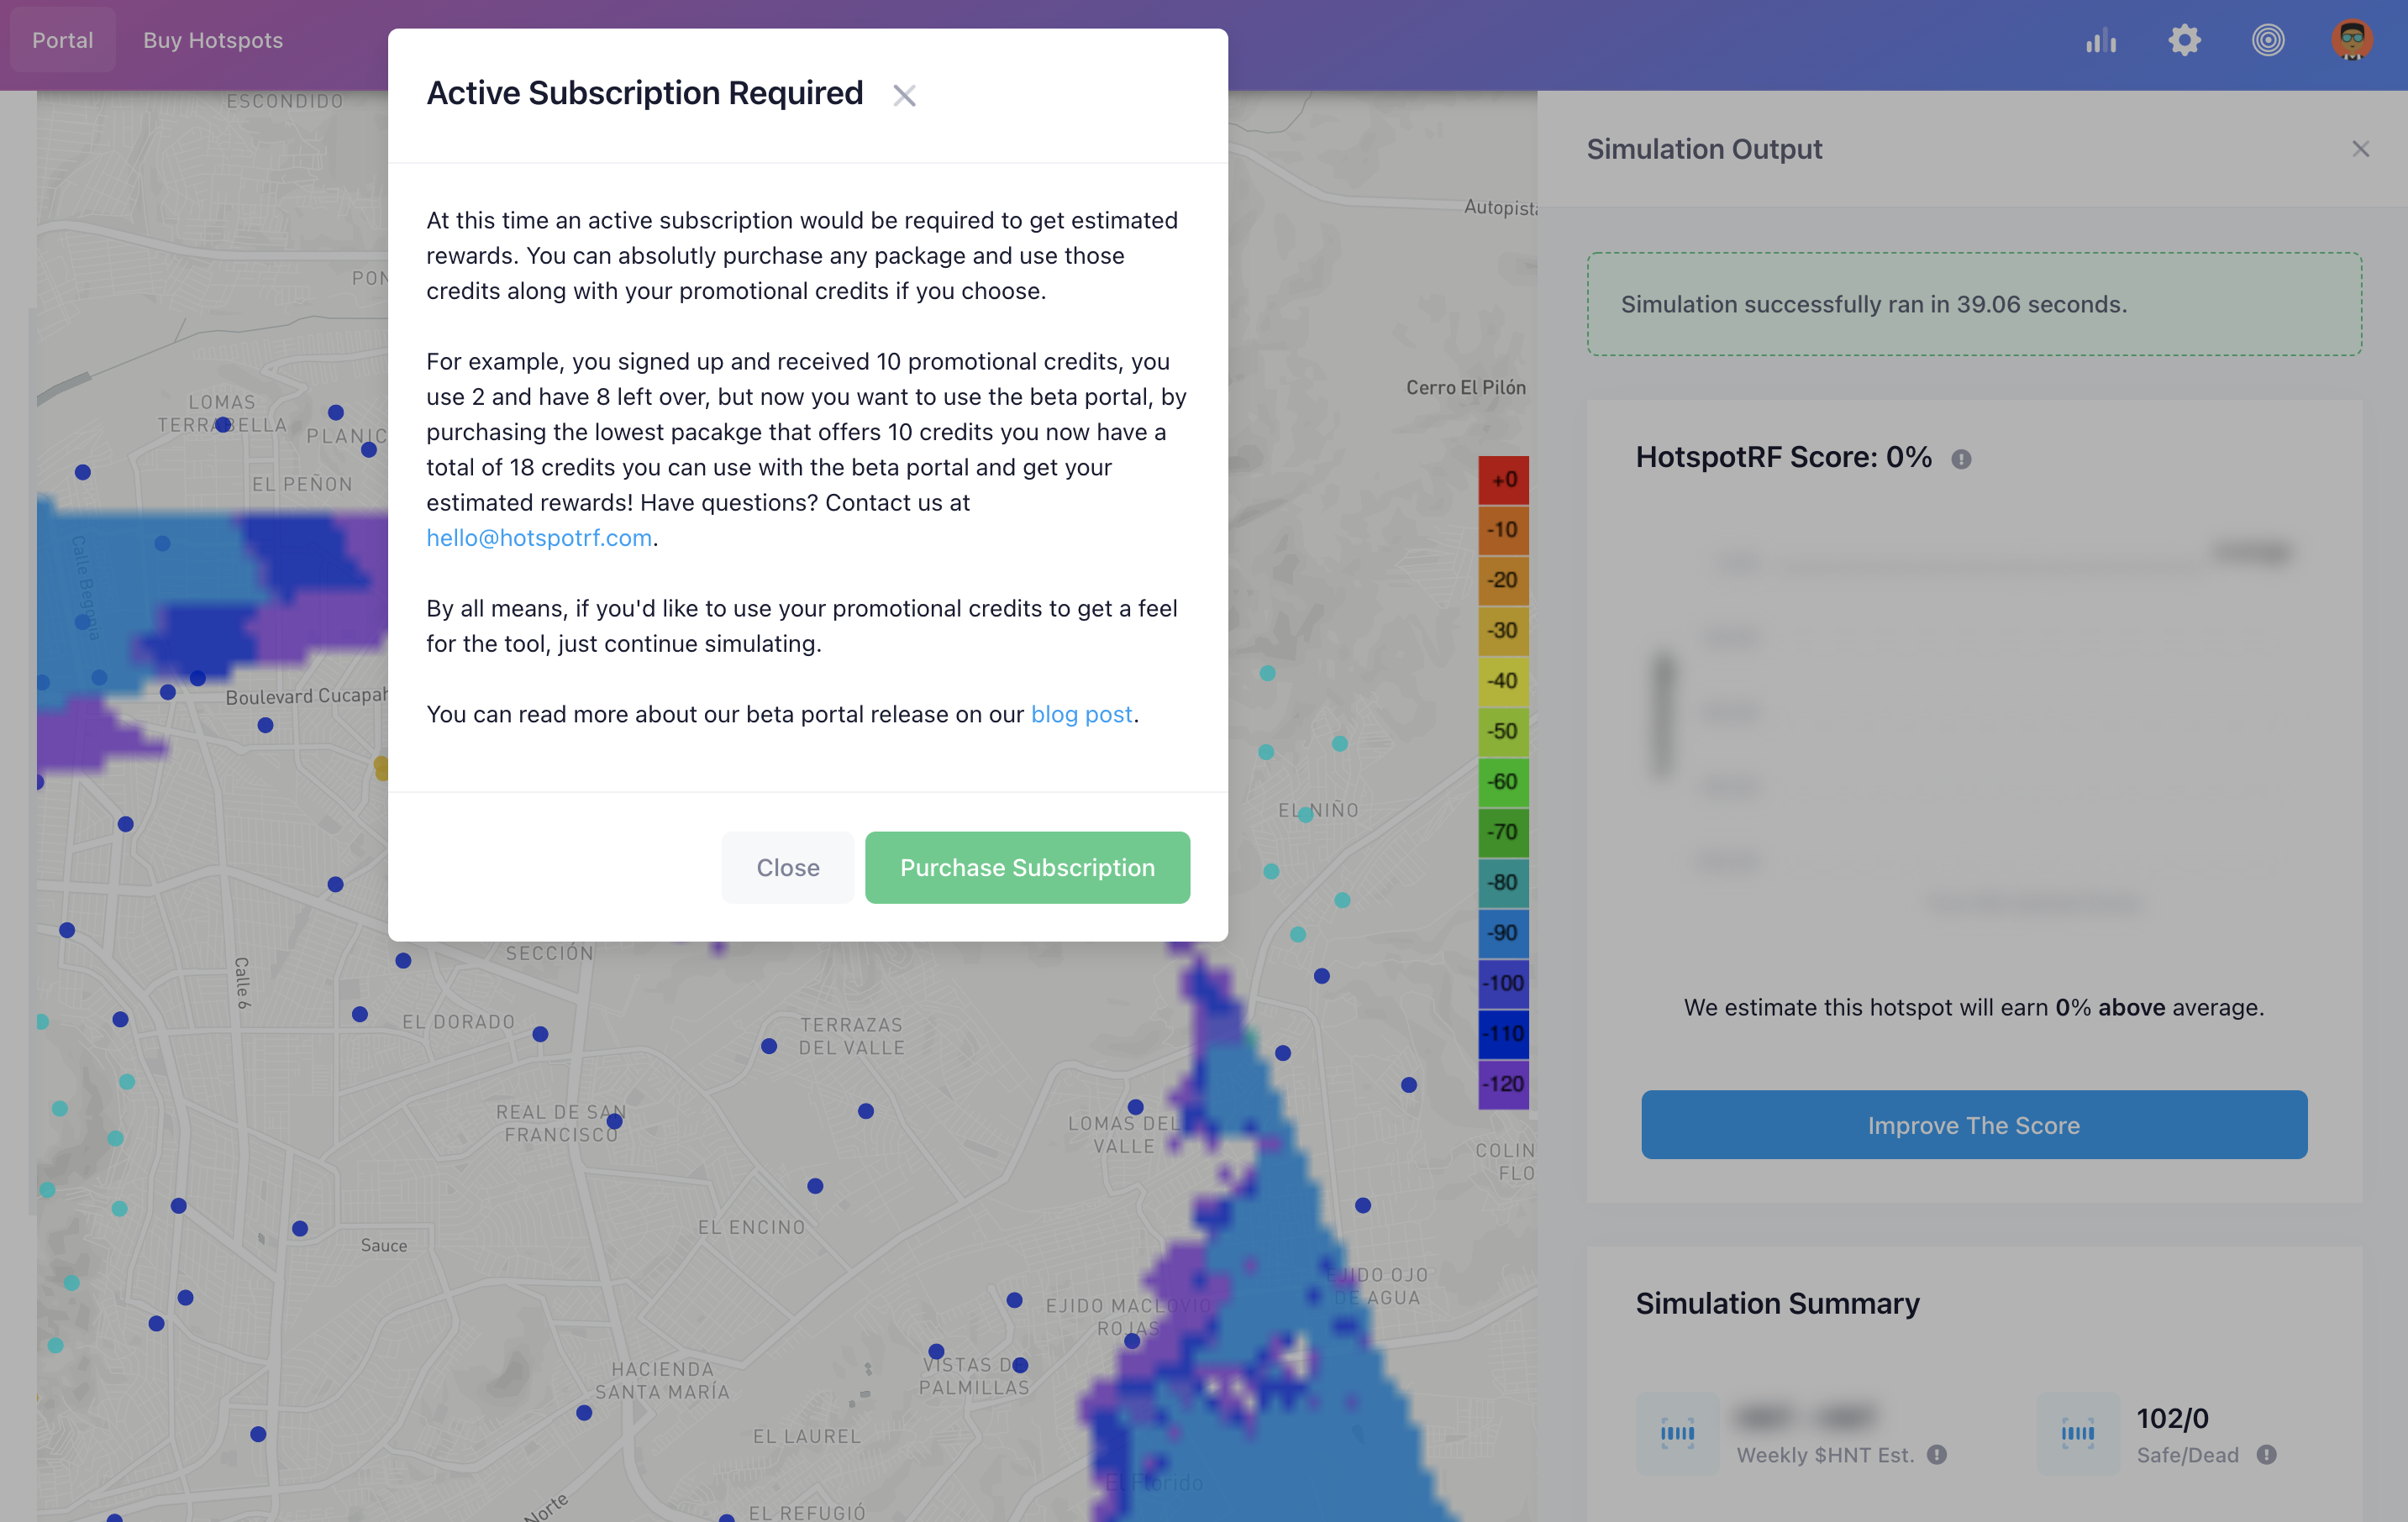
If this is your first time using it and you haven’t signed up yet, you’ll get the “Active Subscription Required” prompt.
I chose a Hobbyist plan. I don’t have a huge need for ETL stats (I get those from another project I’m part of), but if you’re getting deep into the weeds those start to become useful.

After running the sim, HotspotRF predicts that this will earn 21% above local average, woohoo!
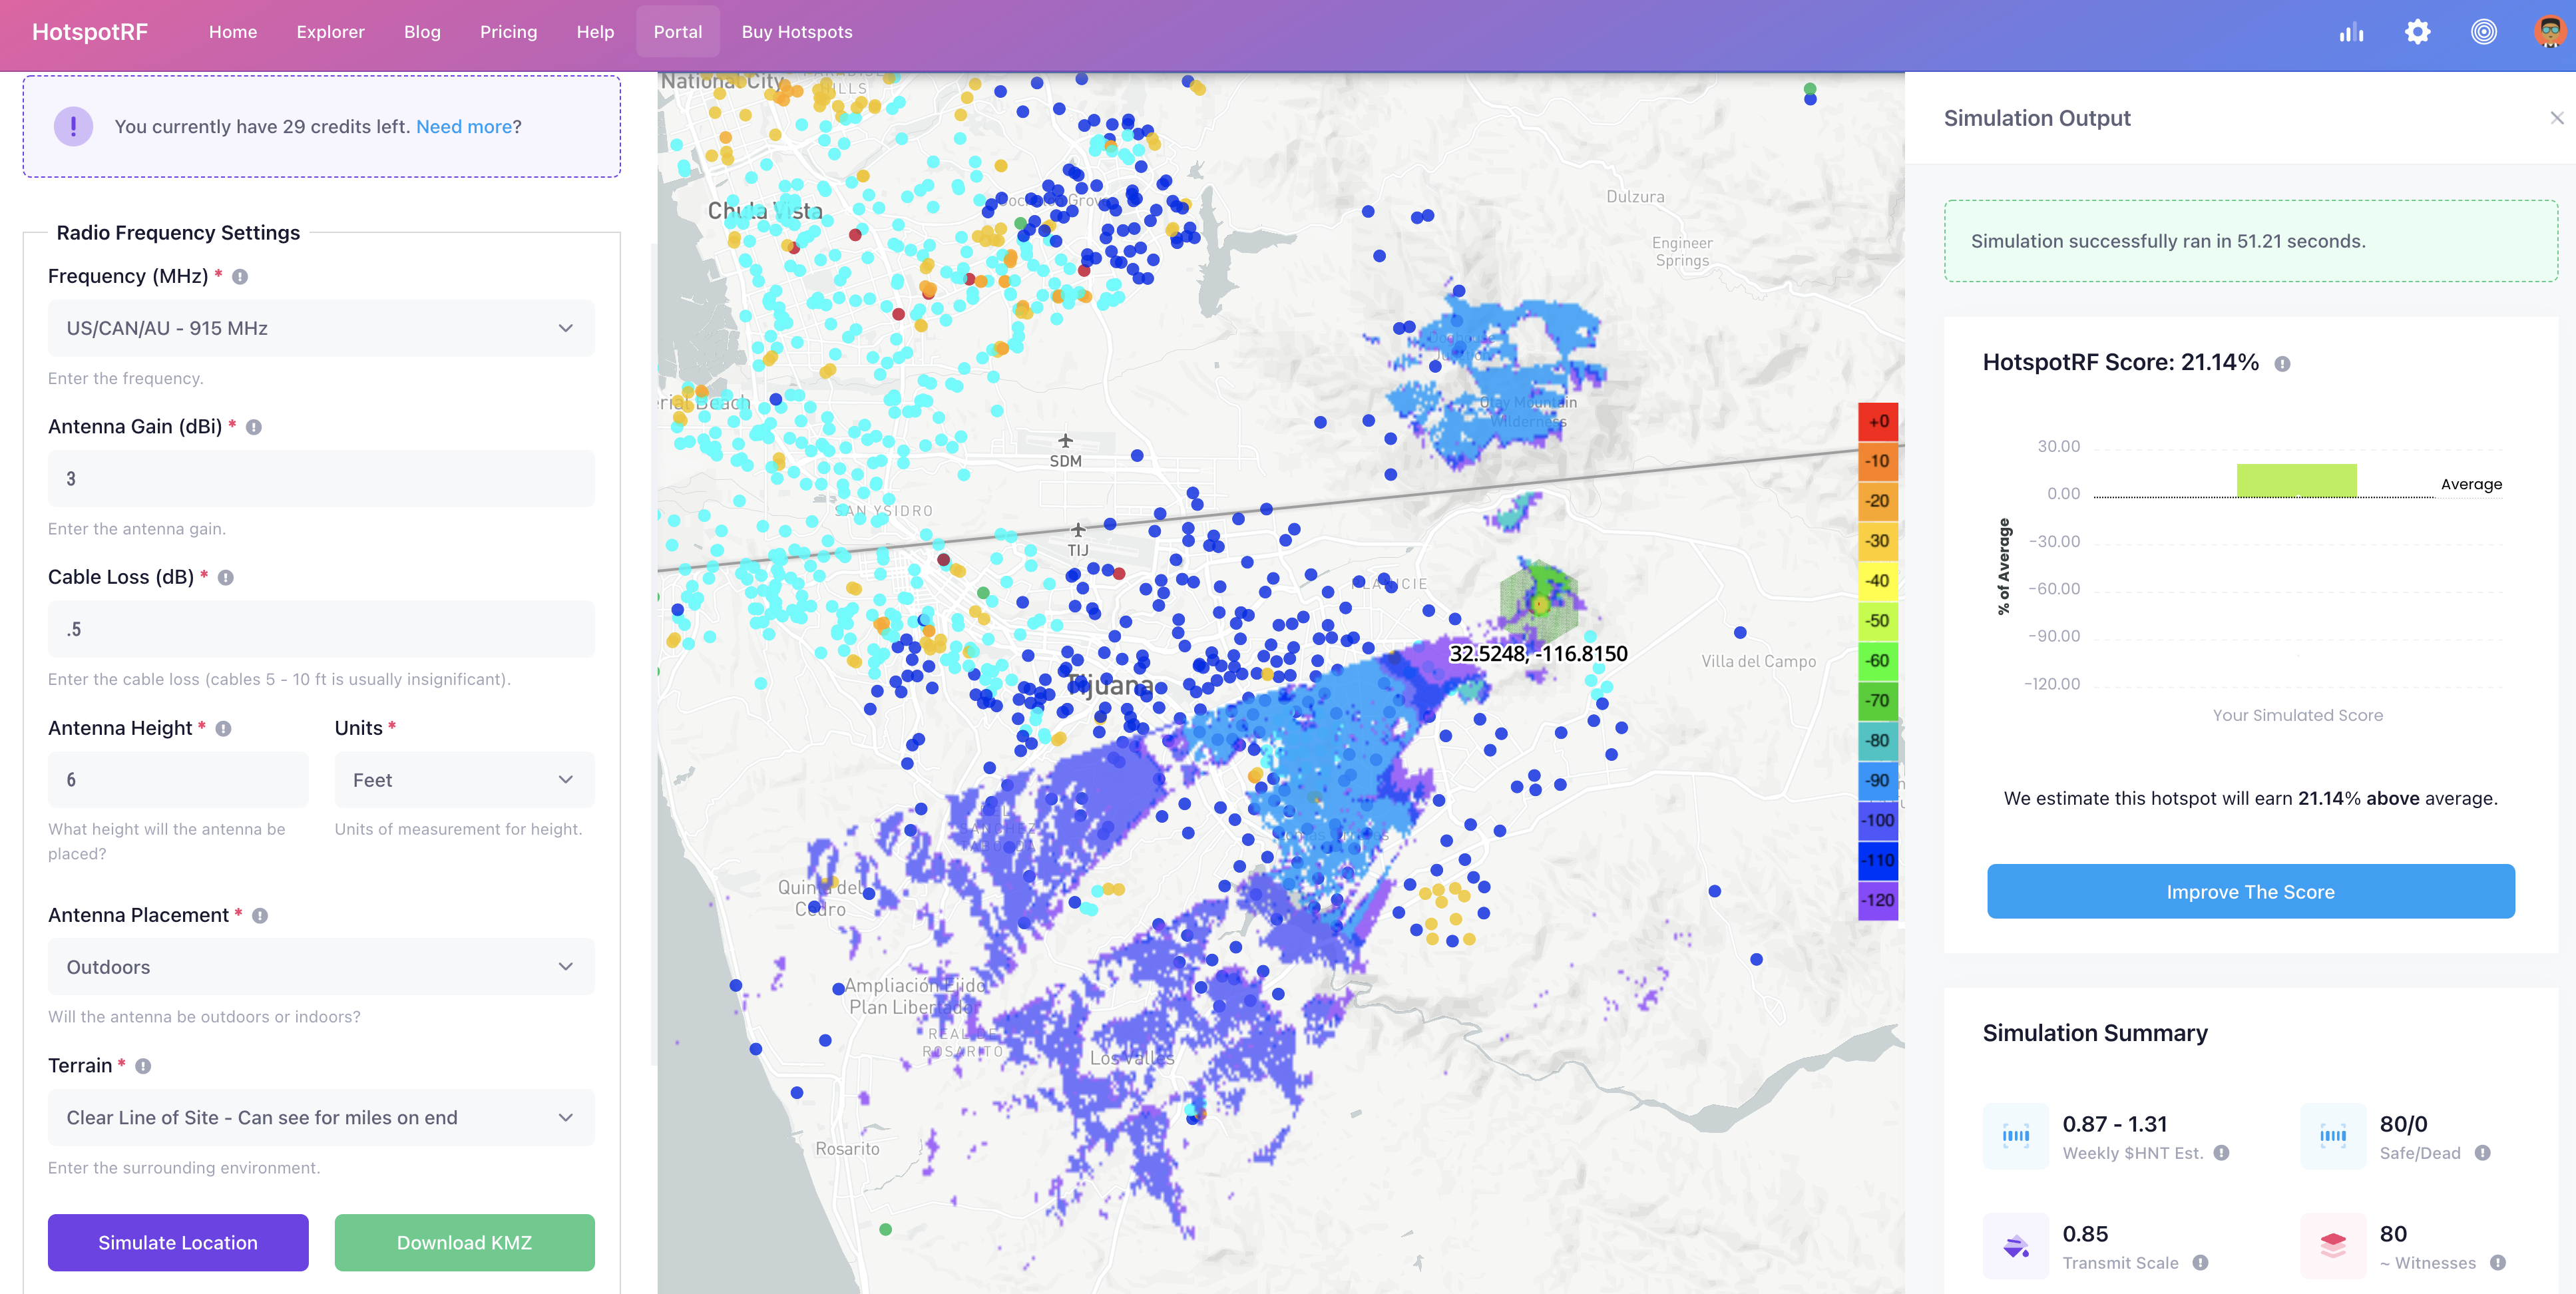
As with all simulations, it’s not a guarantee. For off grid hotspots (which is what I enjoy the most), these estimations will be further off; in the view of the prediction algorithm, off grids are outliers.
HotspotRF makes it pretty easy to get a good idea of the coverage you have. In this case, the spot I (without much map study) picked looks like it has a significant block directly to the west all the way up to the NNW sector. It’s possible I dropped the pin in a small local valley or dip, but I hadn’t seen the Terrain layer in Settings, so wasn’t able to zoom in and get a feel for terrain.
I thought I’d do a quick check on the earning estimates and drop another placement near a known high performing Hotspot. I’d expect this placement to more or less match Amateur Jade Hare, one of the highest local earners here in San Diego (and probably the install I’ve had the most fun with).
To be VERY clear here, the location I’m simulating is on public land and is NOT one you should consider actually deploying a Hotspot to.
This time I turned the Terrain layer on. You’ll notice it’s “sharper” than the real terrain (they do this on purpose). I fly my paraglider in this area all the time, so the difference was noticeable to me. Here’s a quick clip from a flight in Feb 2022 to show what it actually looks like. As I turn right here, about 4 seconds in, you can see the length of the El Cajon mountain. That beeping, by the way, is an instrument called a “vario”, and beeping means we’re going up (in a thermal). This was a lovely day to fly.
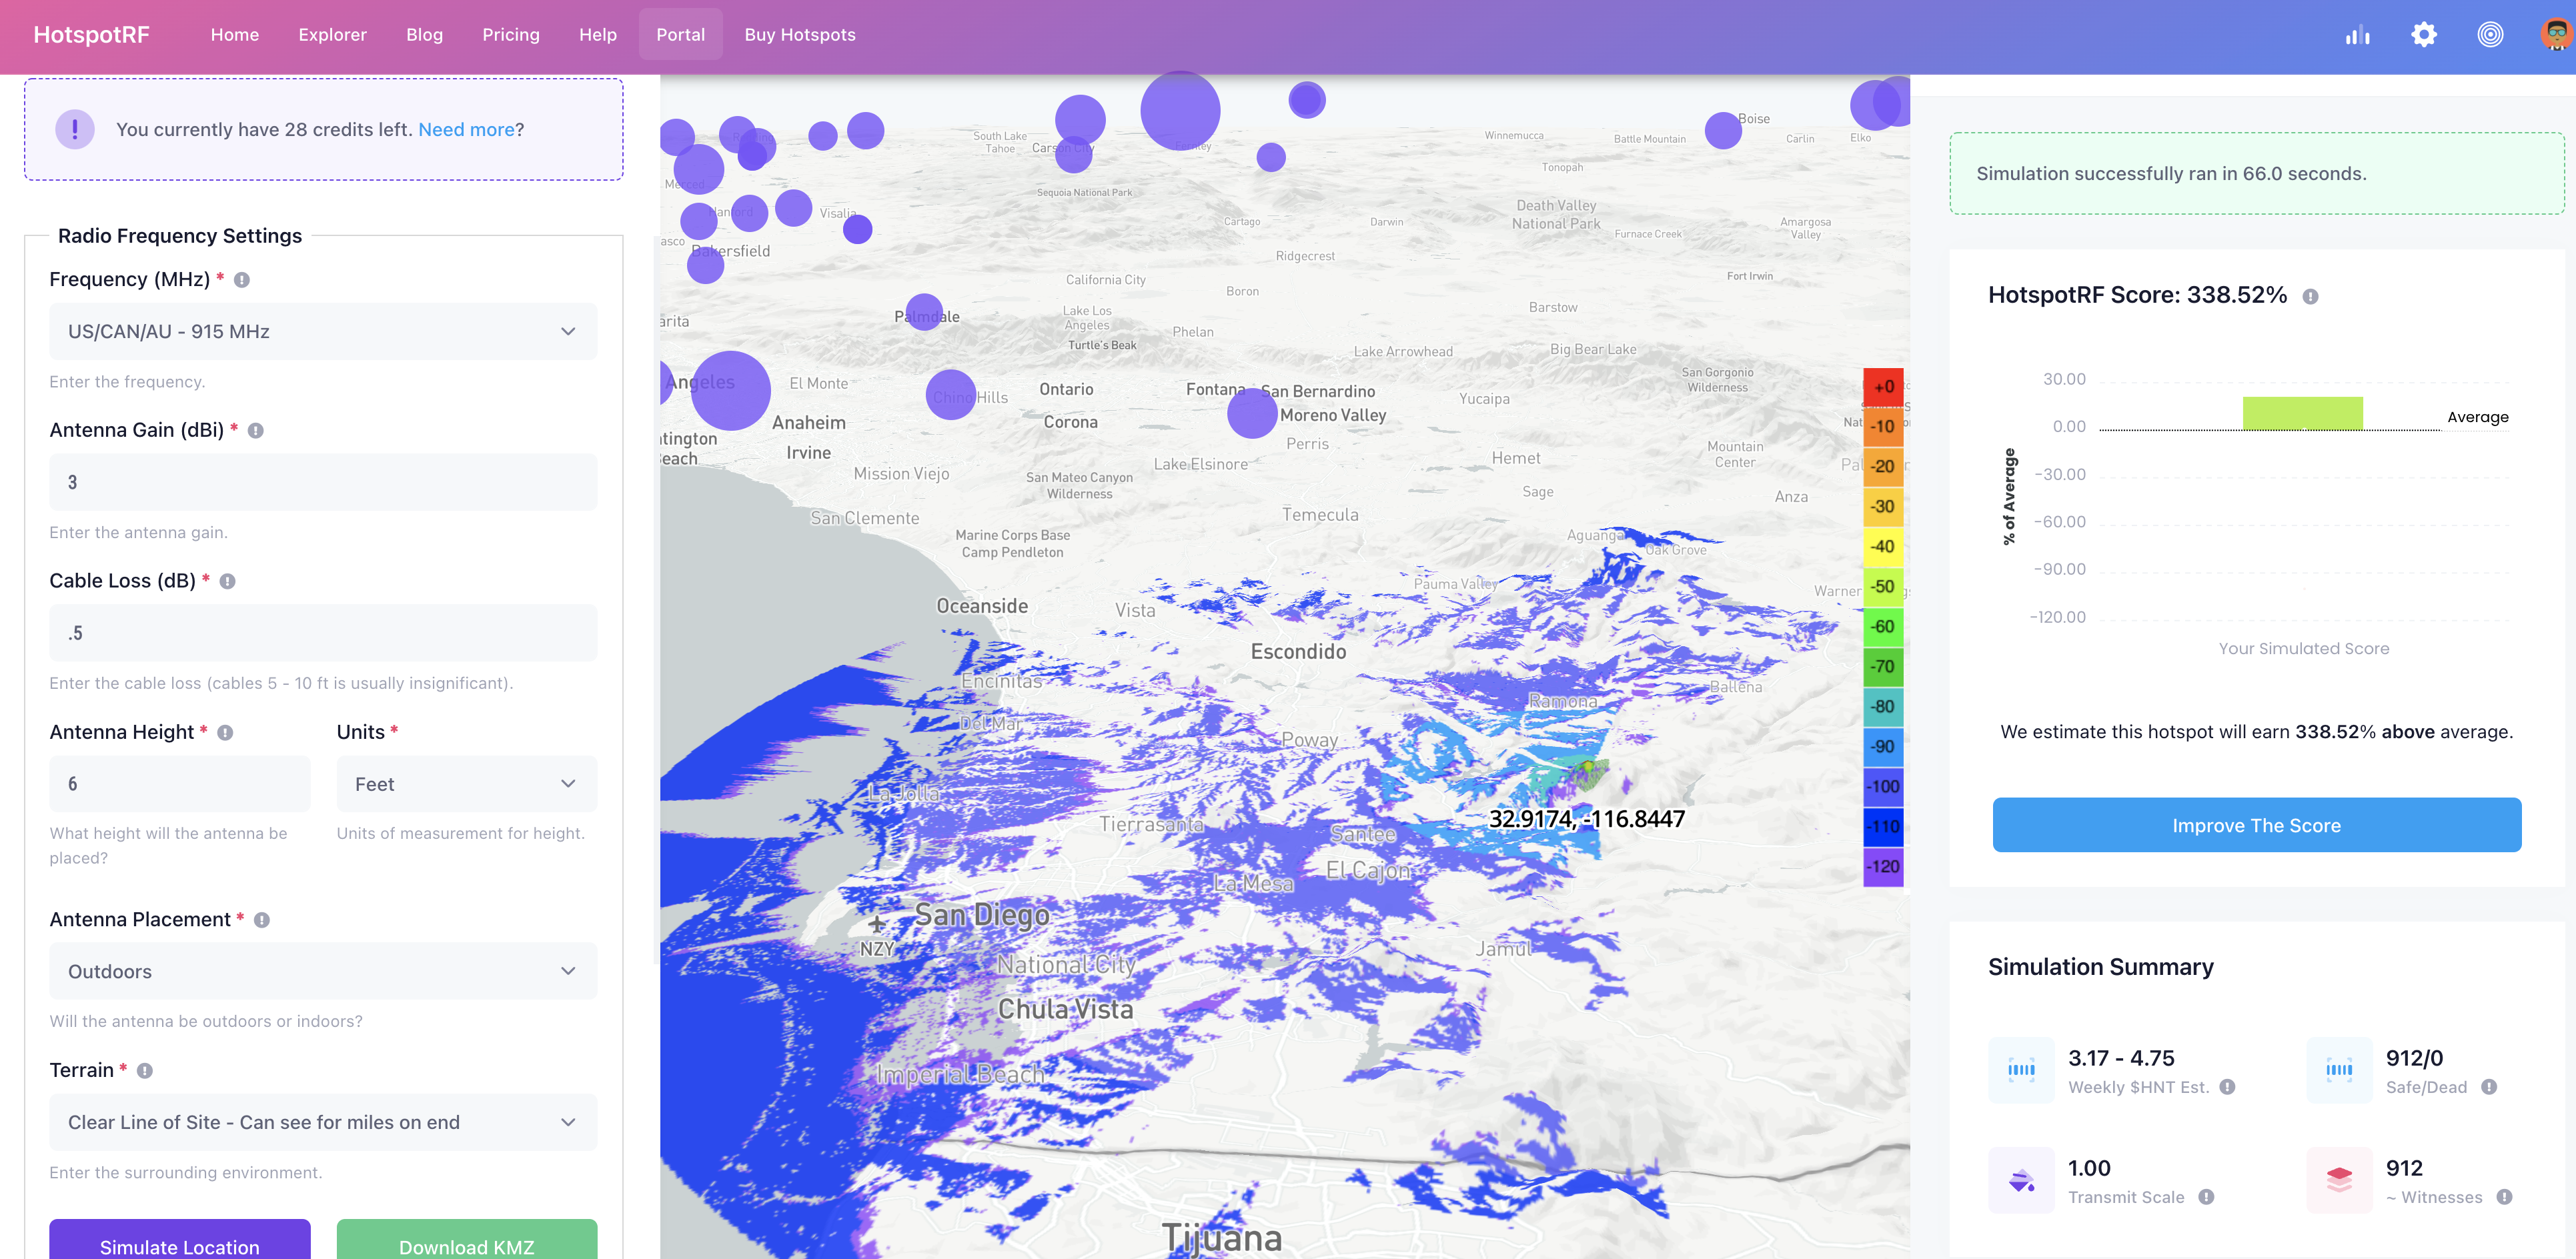
In contrast, here’s the Terrain on HotspotRF, from a perspective further to the south and probably a few thousand feet higher.
We intentionally exaggerate the terrain by 150% to make it easier for users to see the contours of the land and better place hotspots. A lot of users were saying it’s hard to see the terrain before we updated this.
-HotspotRF team
That’s pretty cool in my book; they saw that users were having a problem and came up with a friction-reducing fix unnoticeable to most that solved the problem. That’s the sign of a team dedicated to user experience — very cool!
Ok, so how did the prediction line up with real life? Well, let’s start with a caveat: This is an off grid, and off grids are much harder to predict for a variety of reasons. In this case, the prediction came in at lower than the actual earnings, 19 HNT vs the approx 25 HNT the nearby Hotspot has actually earned over the past 30 days. That’s a good thing; you probably don’t want to over-predict what you’ll make. Here’s the estimate and predicted coverage:
The HRF team dove in to why this happens for off grids, which I thought was pretty cool. It demonstrates to me they have a deep understanding of the field of play, who their main customers are, and how the whole system generally works. That is exactly what you want in a tool like this. I’ll let ’em take it from here:
For crazy off-grid setups like the ones you do, our tool is always going to underestimate the earnings. Off-grid setups are fairly uncommon and more of an edge case compared to the average deployment. Why?
Our algorithm filters out and discounts rewards from hotspots with very few witnesses compared to how many hotspots are in the area.
For example, if you run a simulation and should be able to reach 200 hotspots, but some of those hotspots only have a couple witnesses, we assume those hotspots are “un-reachable” due to poor placement/setup so we ignore them in the calculation.
This is the only way to give the majority accurate estimates, but for off-grid setups, the reality is you can probably witness those hotspots, which is why for those “edge case” deployments our tool tends to underestimate.
-HotspotRF team
For “normal” setups, the estimates are much closer. Keep in mind that for ALL deployments, the amount of HNT you earn per Hotspot will only decrease as the amount of Hotspots on the network grows.
On the rest of the tool, the color coding of hotspots is super simple to understand, and there are a bunch of layers you can use to see Helium coverage and opportunities in different ways. You can hover over a hotspot to see its earnings, which saves you from opening up a window over in Explorer to do the same thing.
HotspotRF also allows you to click on a Hotspot and get quick stats on it; this is a fast way to see if a port is open, how much it’s earning, who its witnessing, etc.
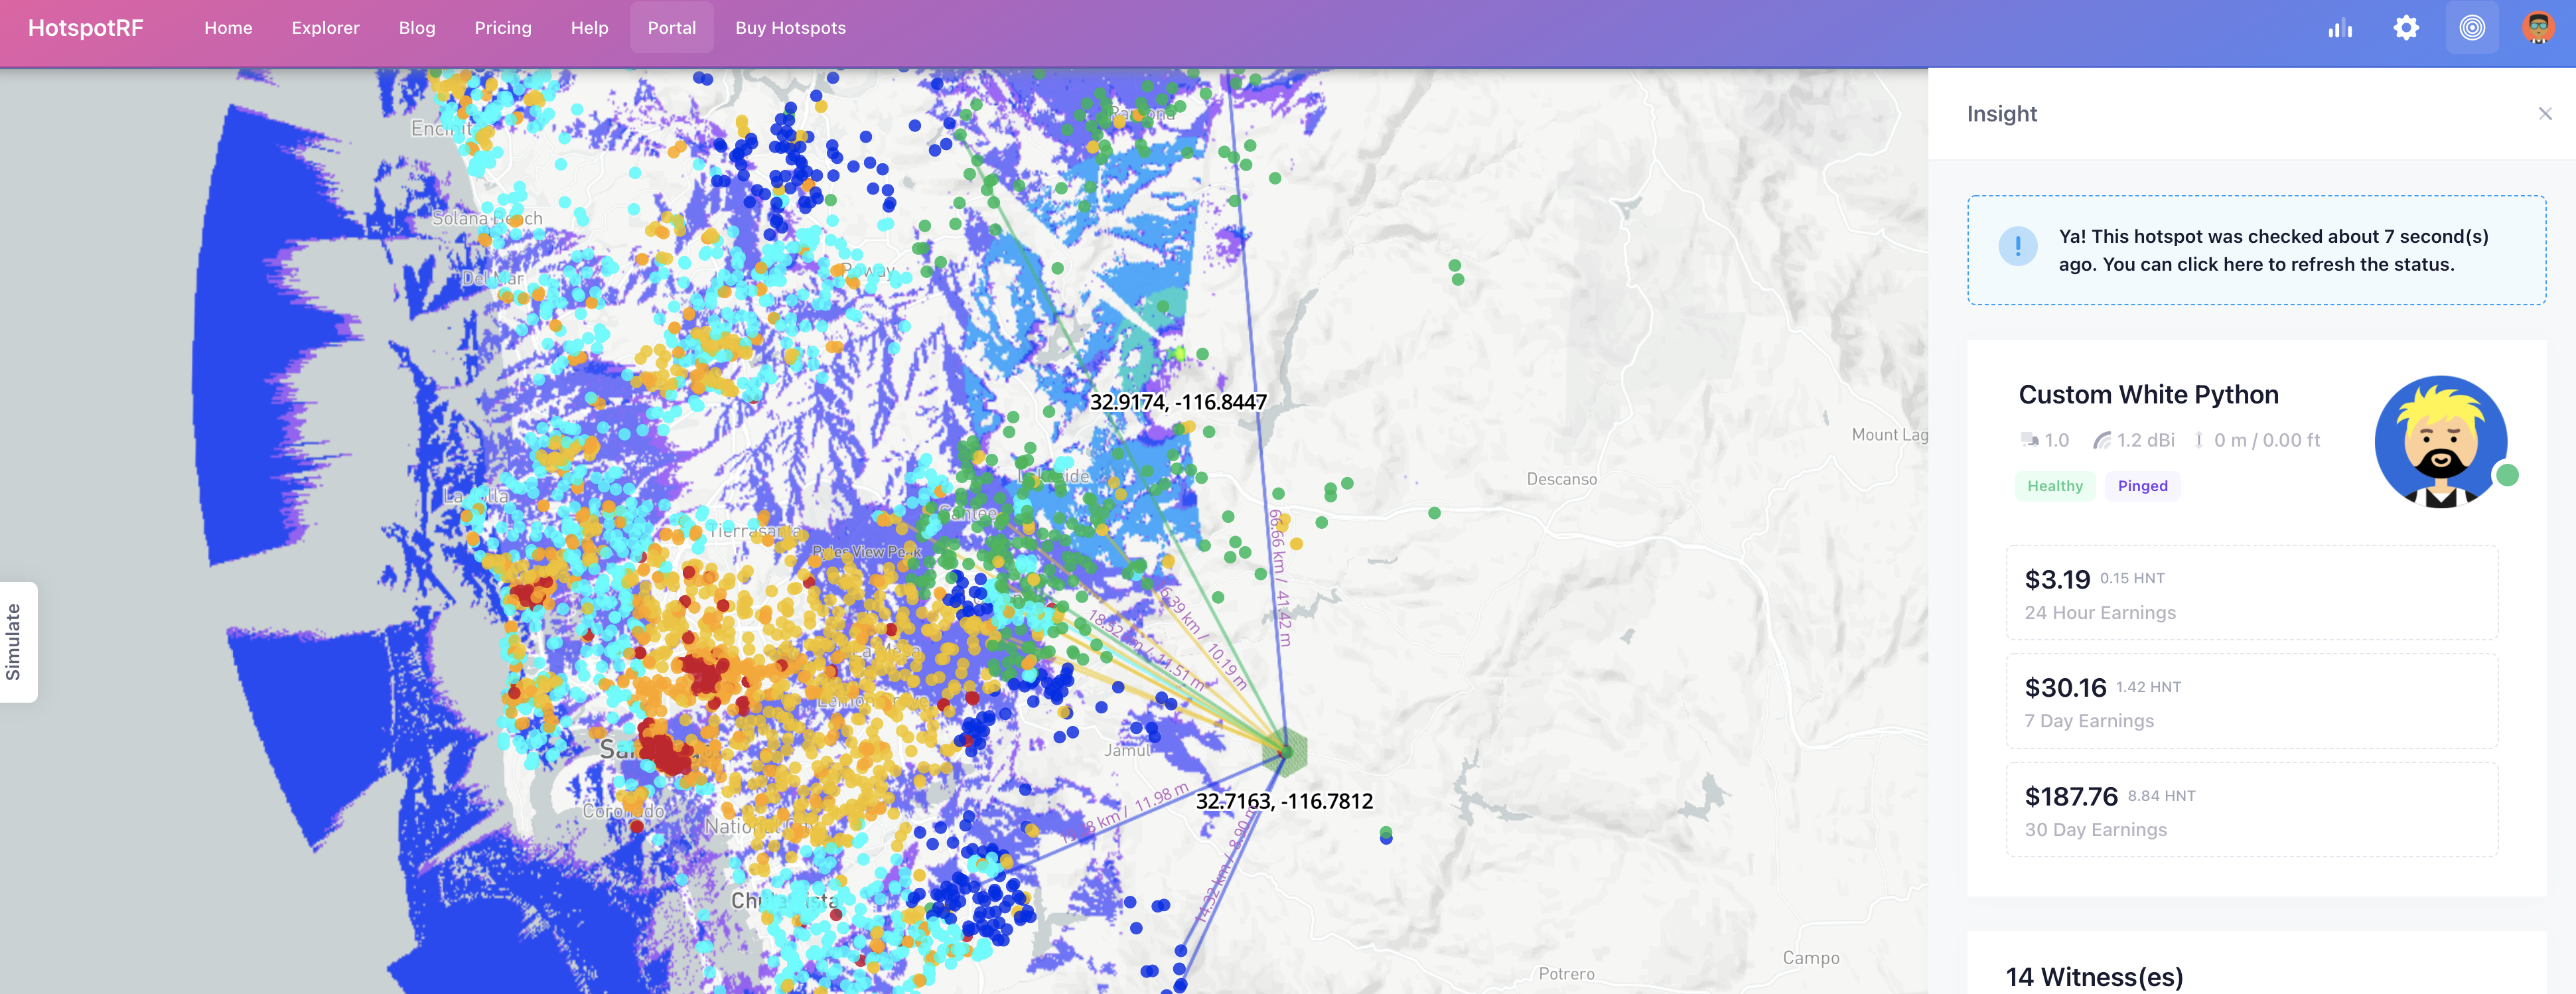
In general, HotspotRF appears pretty darn useful for folks pressed for time and who aren’t looking to manage a fleet, just make assessments.
Here’s the walkthrough with Aidan from back in April of 2021. We had some tech difficulties right in the middle of it, so you’ll see a jump from a day to a night call. Enjoy this new tool!
Want to try HotspotRF out for yourself? Use code gristleking for a little discount, and take HotspotRF for a spin!
If you’d like to join up with a crew of like-minded folks passionate about Helium and discuss HotspotRF (or anything else Helium-related), take a look at the Gristle Crüe, my community of rad folks in pursuit of Helium excellence!

Leave a Reply