While many of you are hammer and tongs at the game of deploying hotspots, the real opportunity is beginning to shift from *building* the network to *using* the network.
One of the best ways to learn something is to do it. Let me show you how, for about $40, you can add your first sensor to the network and visualize the data.

Before we get there, let’s think about why this is important, and how knowing how to do this will give you a competitive edge. This’ll go into strategy and theory plus my own predictions, so if you just want to skip theory and get started, jump here.
Strategy and Theory — A New Network
Helium is participating in a movement that is the single largest jump in human evolution for the past 10,000 years or so. If you would wind back in time 10,000 years to the pre-agricultural era and talk to a hunter-gatherer, the information they knew about the world would melt (or at least temporarily re-form) your brain.
From odd aspects of sensing the world, like ocean navigators dipping their scrotum into the sea to feel very slight water temperature differences that indicated what current or part of the world they were in, to Native Americans who knew where the animal they were going to hunt and kill that day was well before they left camp, humans had a highly developed internal view of the world. This was based on paying attention to senses so finely tuned as to be unbelievable today.
That view is almost entirely lost, and any individual human will probably never experience it again. We will experience something even richer.
With the help of edge computing, a wide deployment of sensors and sensor types, and the burgeoning ability to both visualize and use data, we humans are beginning to re-understand our world. Helium is a part of this.
When you deploy a Helium hotspot, you’re probably aiming to maximize your HNT earnings. That’s cool, so am I, and on top of that I’d love to help you with it. Still, the thing you may not be thinking about is what’s beyond the HNT earnings. What are the opportunities that are popping into existence just by you and a few thousand others building our own network that moves data from invisible to visible?
The simplest explanation is that by increasing the “data density” of a business, then by showing them how to use that extra data, you give them a valuable competitive edge. In some cases that edge will save them money. In some cases it will make them money.
This data density is the “new and improved” version of how we humans sense the world. As a quick (and non-monetary) example, imagine the hunter-gatherer from 10,000 years ago. She knew where to go that day to find the best food because of her individual sensory connection to the weather and season, but she couldn’t really share that knowledge with you, other than to tell you where to go.
If you deploy a weather station network of 20 units over, say a few thousand acres, you will have created a far denser sensor network than any standard weather station deployment, and ANYONE IN THE WORLD can have instant access to that data. If you decide to help people visualize that data, now you have added tremendous value that is available to anyone who wants it. Maybe you charge for that data. Maybe you don’t. Maybe you share it in a way that other experts can help you refine your understanding further. Whatever you do with a sensor network like that, you are contributing to elevating our human understanding of the world, and that’s pretty damn cool.
Now, you can apply this data density idea any where you can imagine, so start imagining.
Is it useful for the local trucking company (or an Amazon DSP) to know where their vehicles are at 12 second intervals? Is it useful for your local restaurant to know the inventory levels in an off-site kitchen, and for every other company who shares that off-site location to also know their inventory levels based on weight-plate sensors?
Will FedEx see a use for tracking individual packages, or pallets, or trucks, or airplanes? Would a supplement company benefit from tracking the provenance of it’s supplies, so you know the high-end collagen you bought actually came from animals humanely treated, and if you wanted to you could track from cow to coffee? You ARE putting collagen in your coffee, right? Wait, that’s another article.
How about your local government? San Diego sure could benefit from knowing when wildfires were starting way before they get reported by human senses. Deploying a network of air quality sensors might save BILLIONS of dollars if we can stop a wildfire when it’s only covering ½ an acre.
When it comes to deploying sensors, the only limit to creating and using data density is your imagination
So, how do you go about adding to this data density?
Let’s get started!
Here’s a broad overview of how the whole thing works:
- Buy a sensor
- Sign up for a Helium Console account
- Provision your sensor (this just means you claim ownership of it digitally, so that you’re the one controlling the data flow)
- Connect that sensor to some kind of data visualization platform
- Deploy the sensor
Step 1: Buying a Sensor
I suggest starting with something simple and cheap. I’ve deployed a bunch of the Dragino LHT-65 temperature and humidity monitors. I use them to act as a double-check on monitoring whether or not a hotspot is up. They’re usually under $50 with shipping and don’t use much data. Do NOT throw away the box with the DEV EUI sticker on it. You’ll want that info. We’ll see a quick tip to see a long list of sensors in the next step, Provisioning.
Step 2: Provisioning the Sensor
You’ll need to set up a Helium Console account. Helium has an excellent set of instructions on their site for how to do that, head over there and follow the steps to get yours going. Helium has also done a great job of walking you through adding a specific device.
Since you already bought the LHT-65, we might as well follow the steps for that one, here. Yes, typing in the DEV EUI, APP EUI, and APP KEY is a PITA. The only shortcut is using the QR code on the device to give you the DEV EUI, which you can then copy/paste.
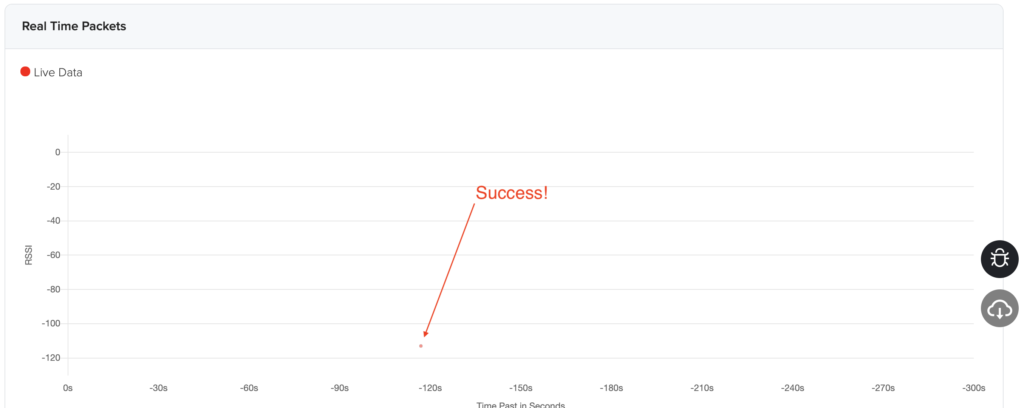
Ok, now that you’ve got a sensor, a Console account, and you’ve provisioned the sensor, you’ll need to activate the sensor. In this case, that means you push the only button on the device for at least 3 seconds. Yeah, it’s that easy. Here’s the manual if you want to dive in deeper. It may take a few minutes for it to show up in Console. I recommend getting the LHT-65 outside and within direct Line of Sight to your nearest hotspot just to ensure this first process goes smoothly.
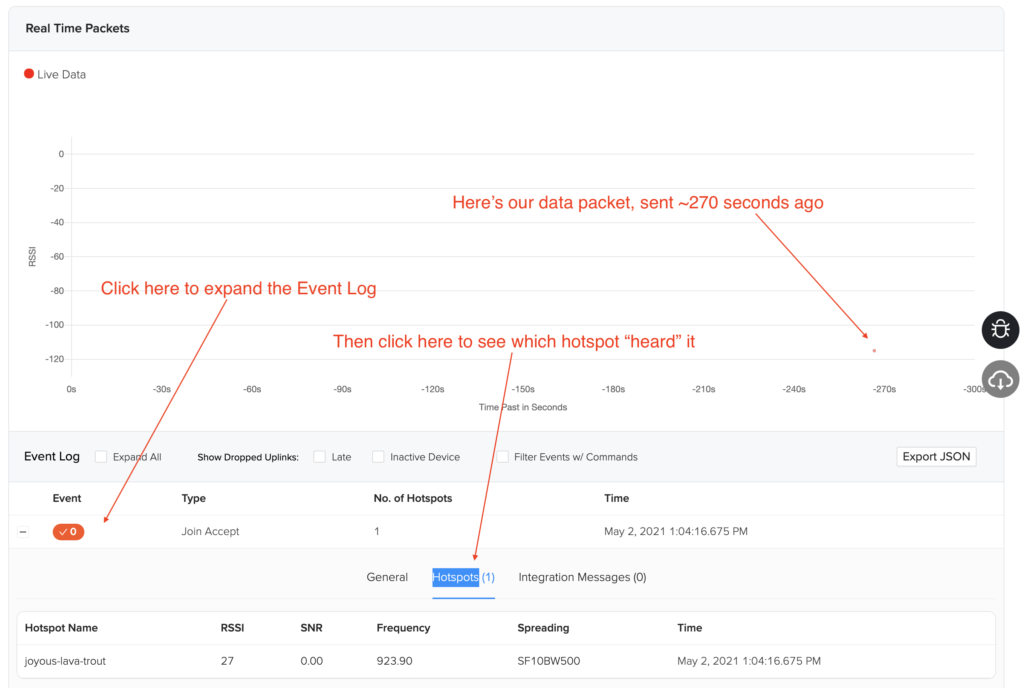
You can watch as nearby hotspots pick it up. Scroll down to the Event Log, open up an Event, then click on Hotspots. That’s the hotspot that’s “hearing” your device.
Now let’s talk about integration with data visualization platforms.
Step 3: Connect & Visualize
As you’ve probably seen after following those steps, Helium Console is not built for the average person to just look at and visualize data.
For that, you’ll need to connect your Console account to another platform. If you want the easiest version, just follow along with Helium’s LHT65 instructions and use myDevices Cayenne. It’s free and easy.
You can use other tools to visualize the data as well. From your Helium Console window, click on the Integrations menu on the left side and then look for all the pre-built integrations. Let’s try Datacake.
Head over to the Datacake website and set up an account. Once you’ve got that, go back to Helium Console and look for Integrations on the left menu. Click on that, then choose Datacake. There’s a full set of instructions on how to do this, so at the risk of sending you to the Helium site, you should go check those out.
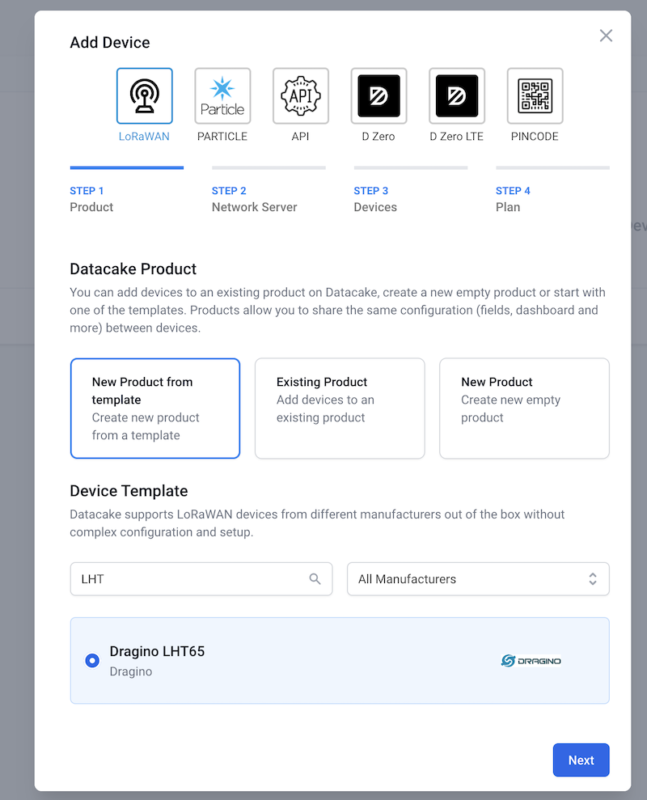
Ok, the next step is confusing. With the LHT65 provisioned in console, you have to tell Datacake AND Console what you’ve done. In Datacake, look for the blue Add Device button, then choose LoRaWAN –> New Product from template–>then search for LHT and click on the Dragino LHT65 radio button. Like this:
Next they’ll ask you to choose the Network Server you want to connect. Look for Helium, then click next.
Now you’ll need to put the DEV EUI in. Hot tip: Use copy/paste to pull it over from your Console account. It will look different than the DEV EUI you’ve typed in, don’t worry. Just copy/paste. Trust me on this one.
For this first device, choose the Free plan and then connect away. That’s it.
I’ve found that it usually takes a while to start actually SEEING the data. Be patient. It’ll come.
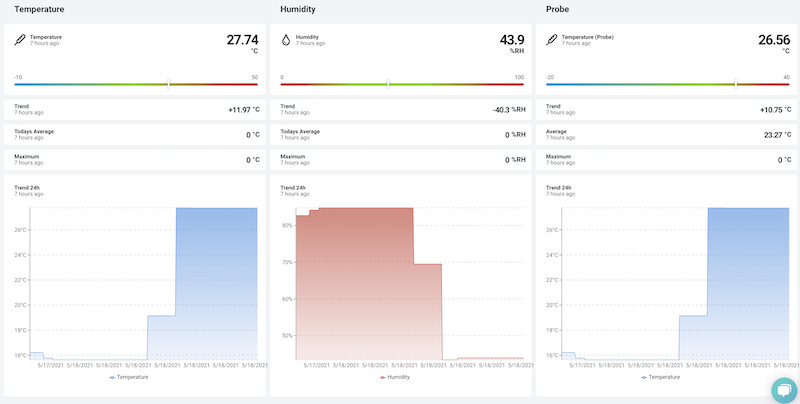
Now the fun part starts: Deploy the sensor! A sensor is just one more tool in your toolbox as you help build this new world of IoT interconnectivity.
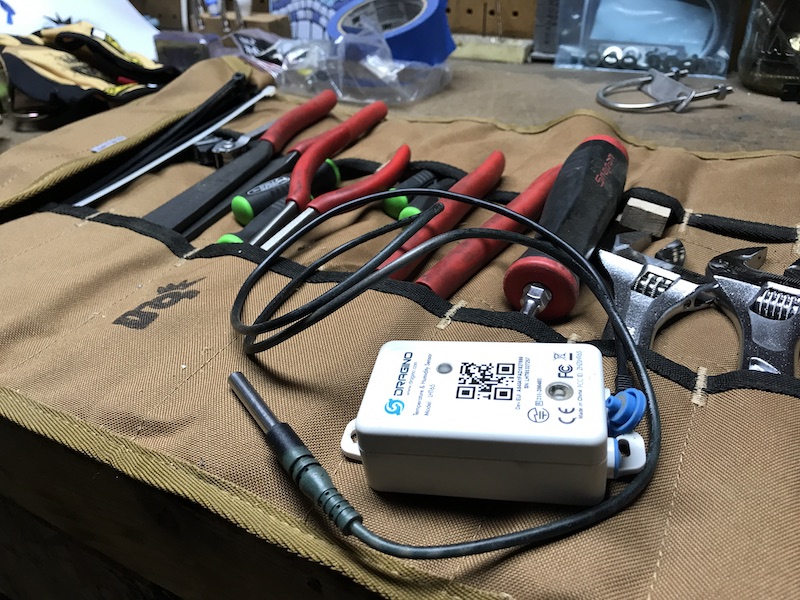
How will you use data to change your world?
Get ’em!

Leave a Reply