Helium is a complex system. If you don’t understand it, that complexity can be REALLY frustrating.
There are radio frequency concepts, Hotspot density rules, different antennas, cables, splitters, and a constantly changing Network. Those all combine to make an extraordinarily complex system. In any complex system, the big opportunity is to look for big patterns and useful data; digging into the weeds can make ya want to tear your hair out sometimes!
Let’s go through a few basic truths, then I’ll intro you to a tool that’ll help make sense of one of the most important parts of the Network for a lot of folks: Earnings.
Truth 1: The amount of HNT any Hotspot will earn will steadily decrease over its lifetime due to the growth of the network. Think of this as a pie that both gets smaller over time (the halving every 2 years) AND gets cut into more and more slices as more Hotspots join and the rewards get divvied up to more and more earners.
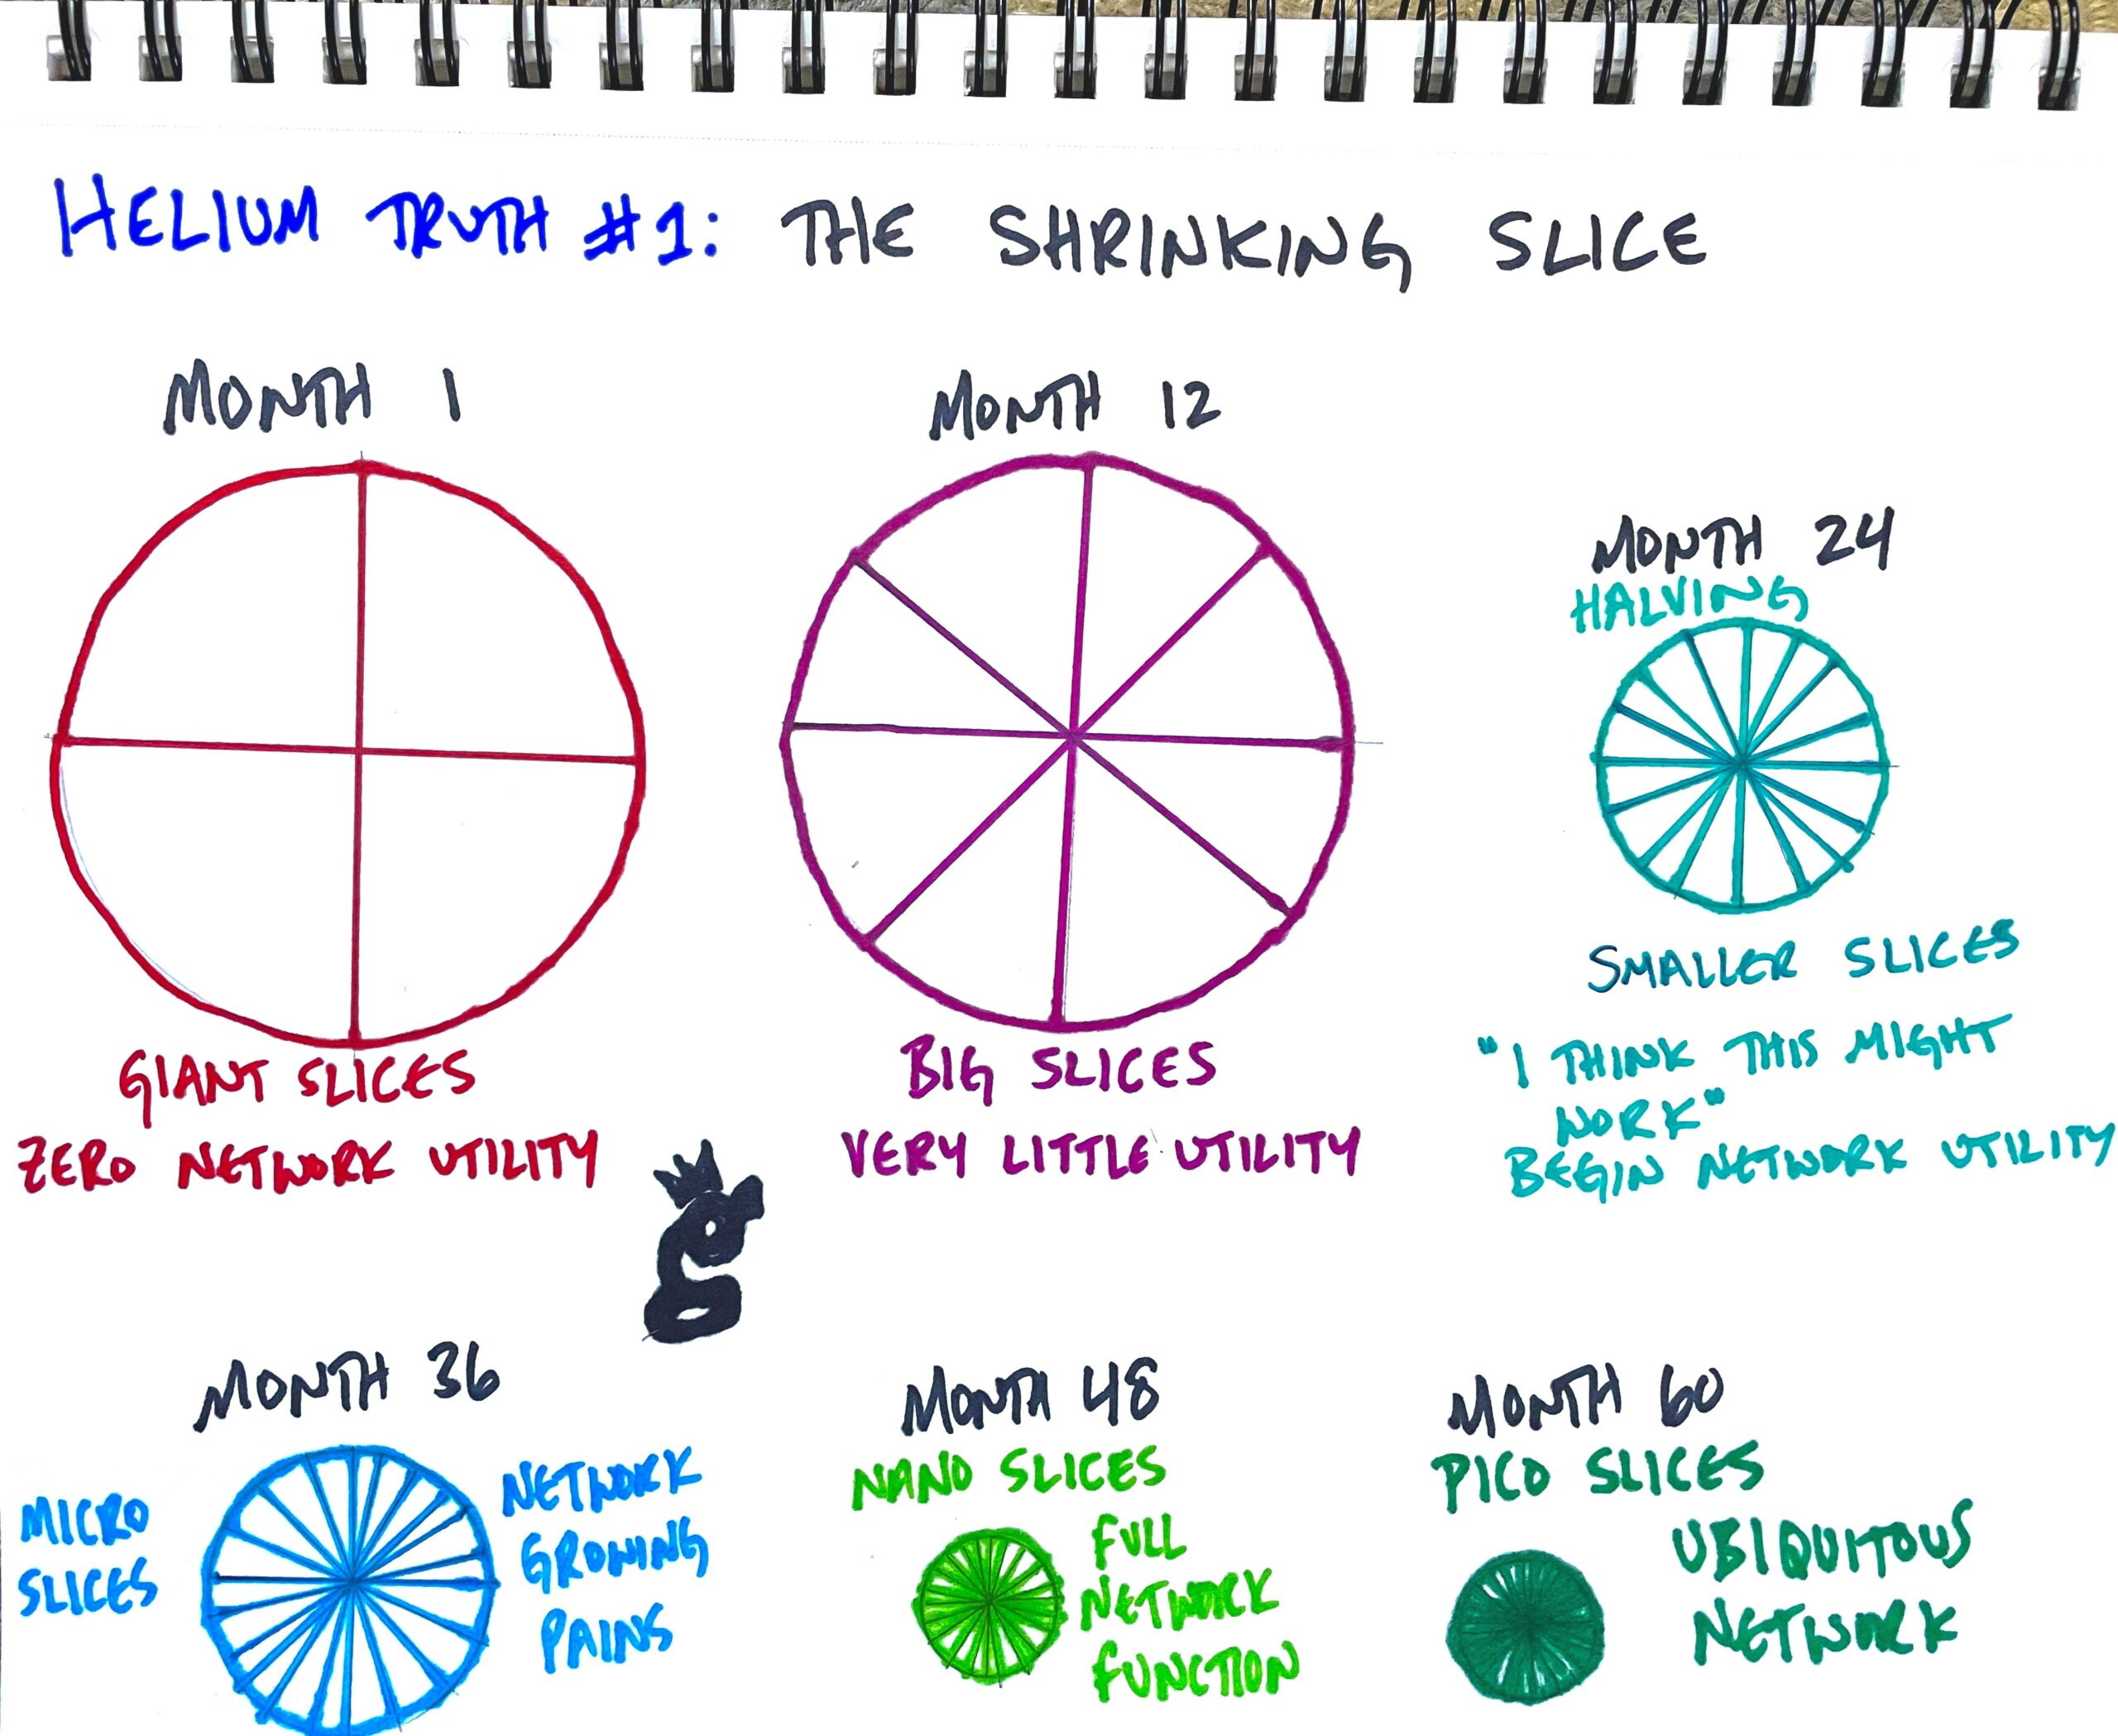
This means that when your rewards shrink, it’s not a scam or a rug, it’s actually a sign the thing is working: The network is GROWING. That’s a good sign for the overall health of the network.
Truth #2: Over time, the Hotspots that earn the most will be ones that provide the most utility to the network. Utility can be measured in two majorly different ways: Proof of Coverage, or PoC, and Data Flow, which is measured in the amount of data transferred through a Hotspot.
At the start of growth, network utility is measured through the first three letters of WUPU (Wide, Unique, Proveable, and Useful) to provide PoC. PoC is what we’re all focusing on now in March 2022, because no one is really using the network at scale yet. PoC is the driving force behind the growth of the network, and is a powerfully elegant way of using tokenomics to build a network before you need it.
Once the network starts to actually get used at scale, utility will be measured by how much data your Hotspot processes.
So, if your Hotspot isn’t earning, first ask yourself how much value its providing to the network. Common mistakes are to think that you’re special and the network owes you something. You’re not, it doesn’t. This is a decentralized network built to incentivize superb radio coverage. Admittedly, it’s not perfect, but it’s not (by a long shot) a scam or a rug. It’s an uncaring measure of excellence, and by definition, most of us will be average.
Truth #3: The data for just about every network statistic is publicly available. It may not be easy for the common internet user to understand, but it’s there. That’s what we’ll dive into for the rest of this, mostly focusing on a rad tool called Helium Analytics, which you can find here.
The raw data for Helium Analytics comes from what’s called an ETL. ETL stands for Extract, Transform, and Load, and it’s basically a copy of the data contained in the Helium blockchain. You can run your own ETL, but it can get expensive to store all of that data. As of March 2022, the blockchain is about 4 terabytes of data. That’s a lot, and a great reason to let someone else take that on.
Thankfully, Dave Akers over at Helium Analytics has done just that. Let’s dive in to the tool he’s built to help you understand all the data the Helium blockchain holds!
Let’s start with what you want to know: Is my Hotspot doing what it’s supposed to do when it comes to earnings?
Now, “supposed to do” means different things to different people. For me, I look at past earnings in 7 day chunks, and I expect that over time those earnings will drop. I’ll typically use the Watchium app for keeping an eye on what my Hotspots are doing (use code GRISTLEKING to get early access), but you can also use the Helium Explorer.
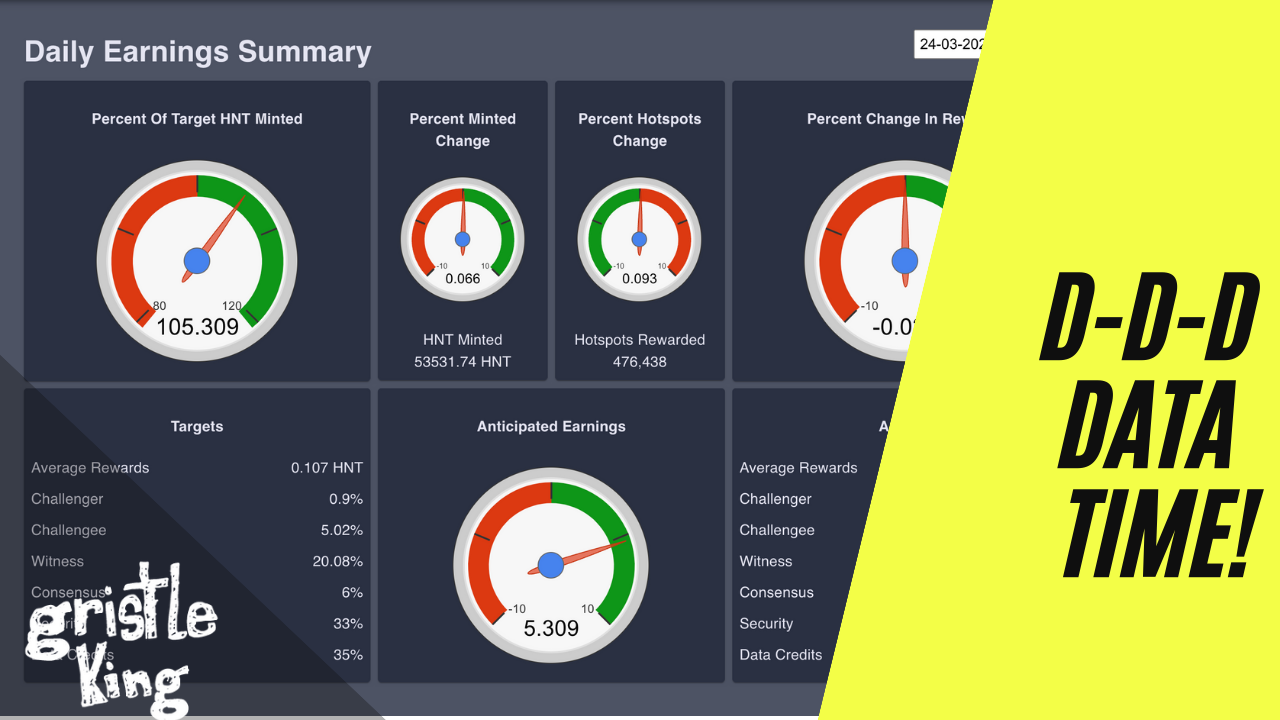
If there is a sudden drop or rise that doesn’t match what I’m expecting, then I look at the global average, both the targeted average (what *should* have happened) and the actual average. Helium Analytics makes this ultra easy. For these examples I’ll be using today, but you can use the date box in the top right to dive deep into the past. 🙂
Go to the Daily Data Rewards Summary, then look all the over on the right side, under “Actuals.”
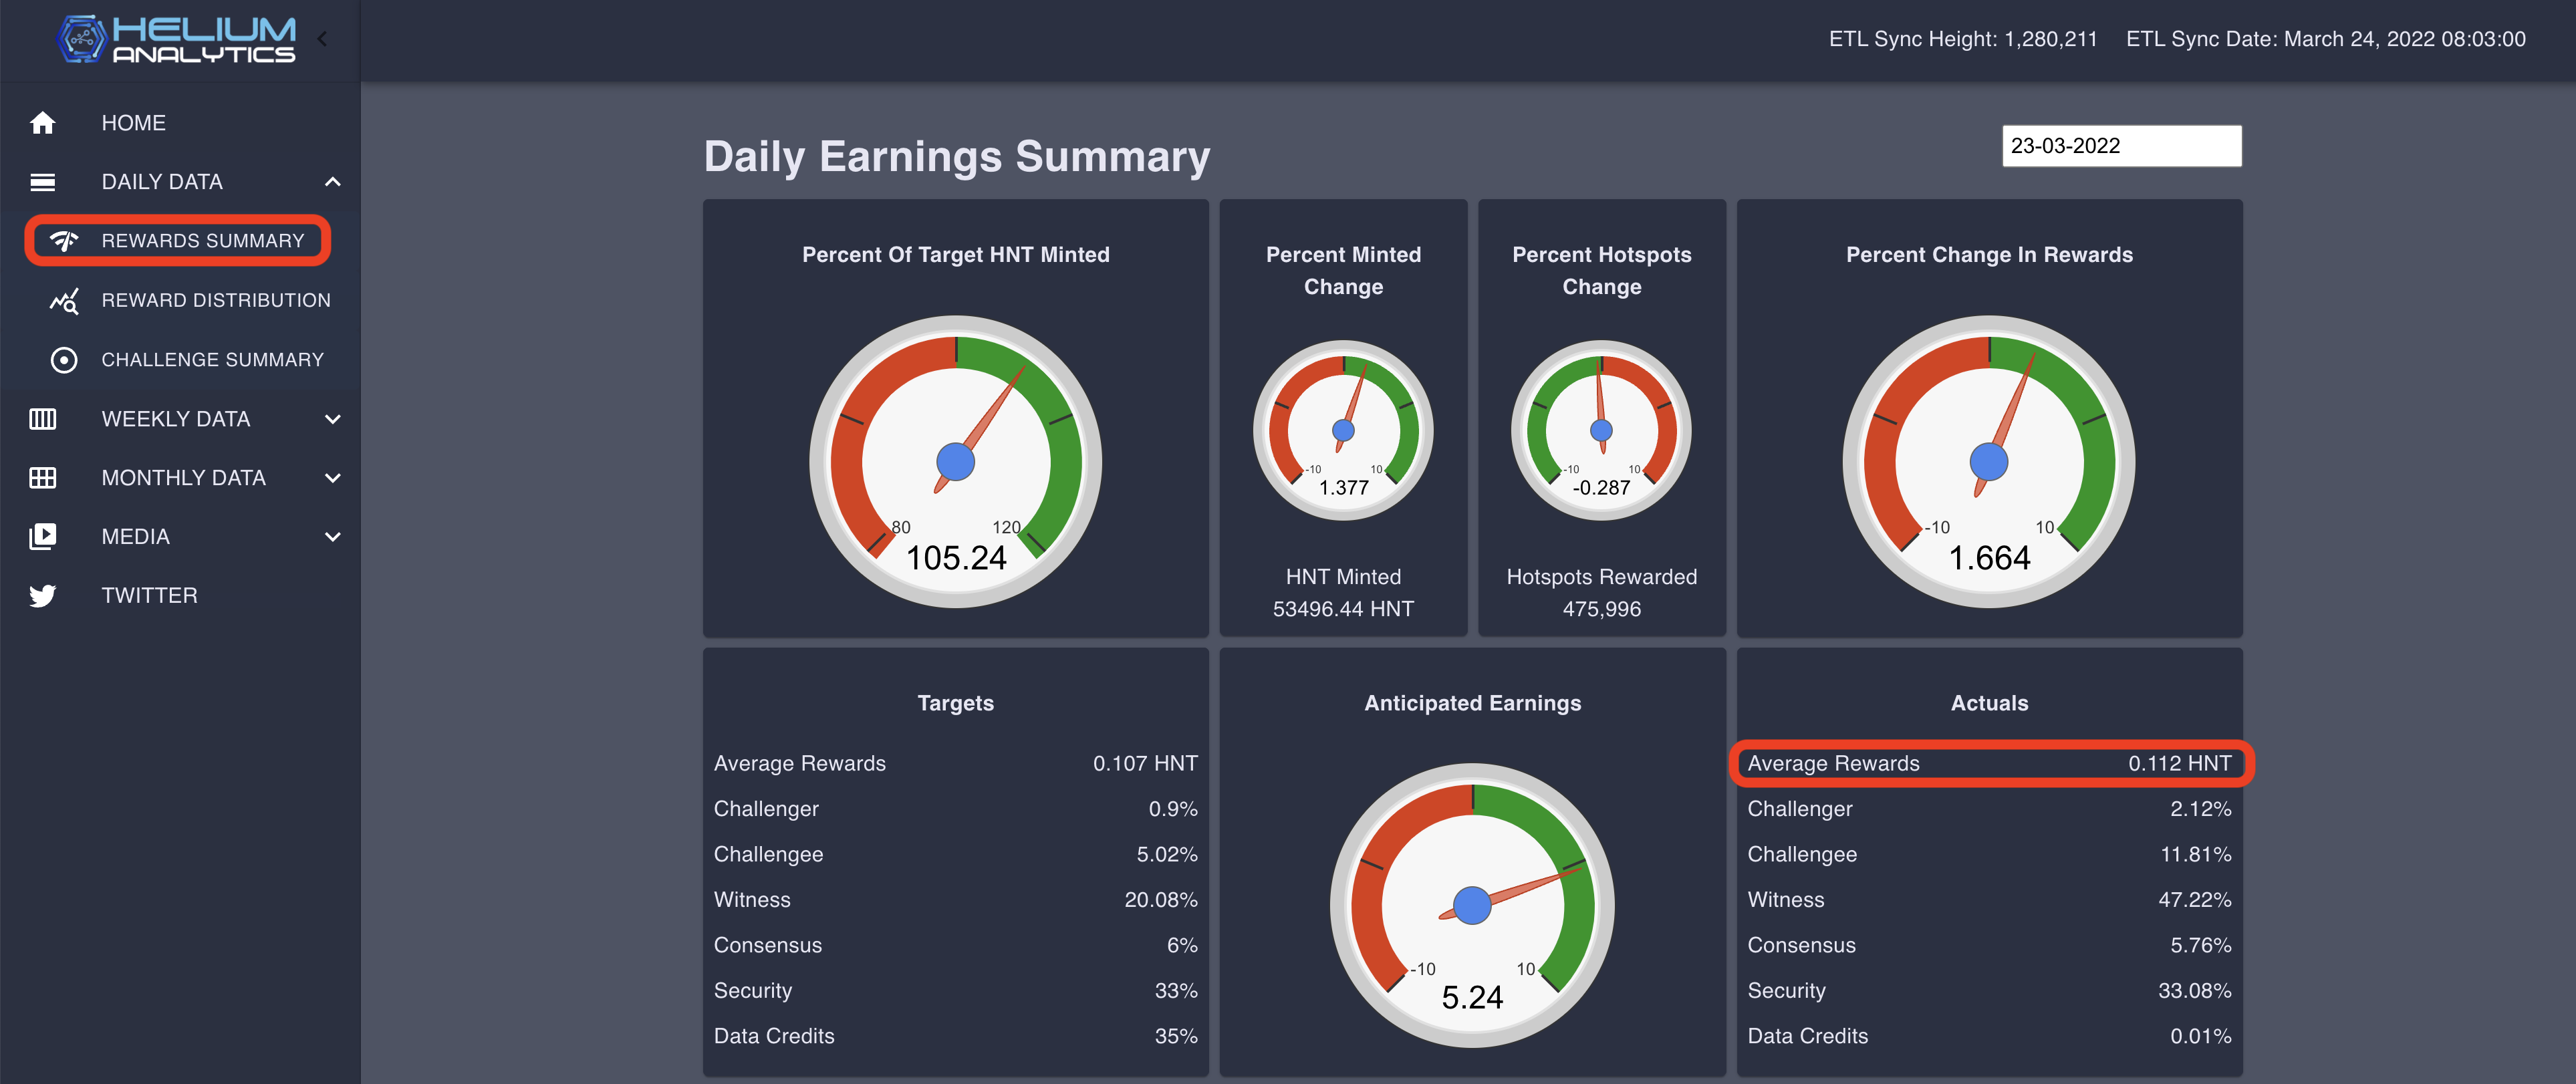
Now for me, I’m kind of a location snob: If it’s not awesome OR serving a very specific coverage purchase, I won’t put one up. I like my locations to be 3x global average at the minimum. Not everyone can do that, I’m just sharing with you what I’m looking for. The important thing here is to see if there’s a temporary global shift in earnings along with where your Hotspot(s) stacks up.
The next thing to pay attention to is whether those dials are in the green or the red. If they’re in the red, you can expect your earnings to be down. If they’re in the green, expect earnings to be (generally) up. All of us who’ve run Hotspots for any amount of time know that earnings are spiky; you’ve got days where you feel like you’re nailing it and days where you wonder what’s wrong. Those are normal.
Ok, now you have a pretty good idea of where everybody else is, and you should have a good idea of where you are. But…you’ve heard that “everyone” on Twitter/Discord/Reddit/FB/YT is complaining of rewards being down. That’s something you can check over on the Rewards Distribution tab.
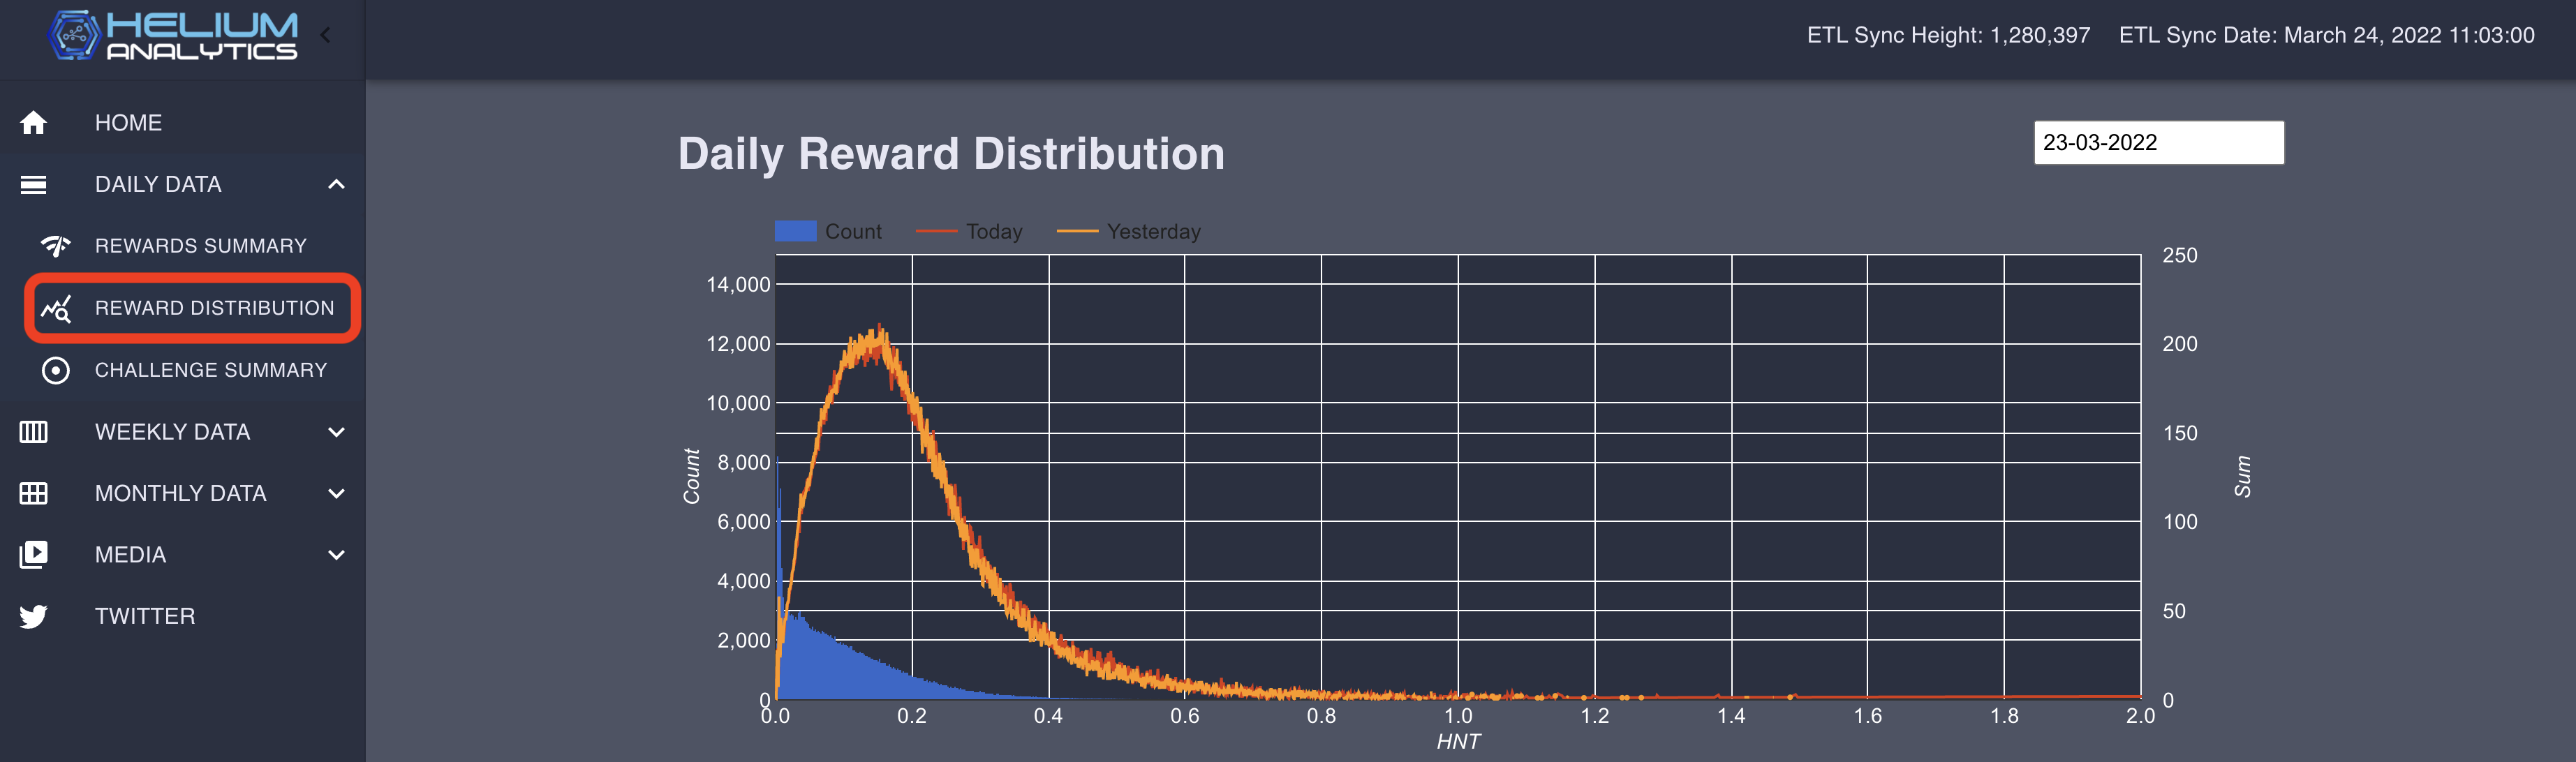
This is a “distribution graph” (Dave at Helium Analytics particularly likes these) with 3 colors on it. The orange line is what happened yesterday. The red line is what’s happening today. If those two lines are overlapping (the way they are in this screen shot, you can be pretty sure that rewards across the Network are not down.
If you see something like this, where the red “today” line is left of the orange “yesterday” line, you know rewards are down across the Network.
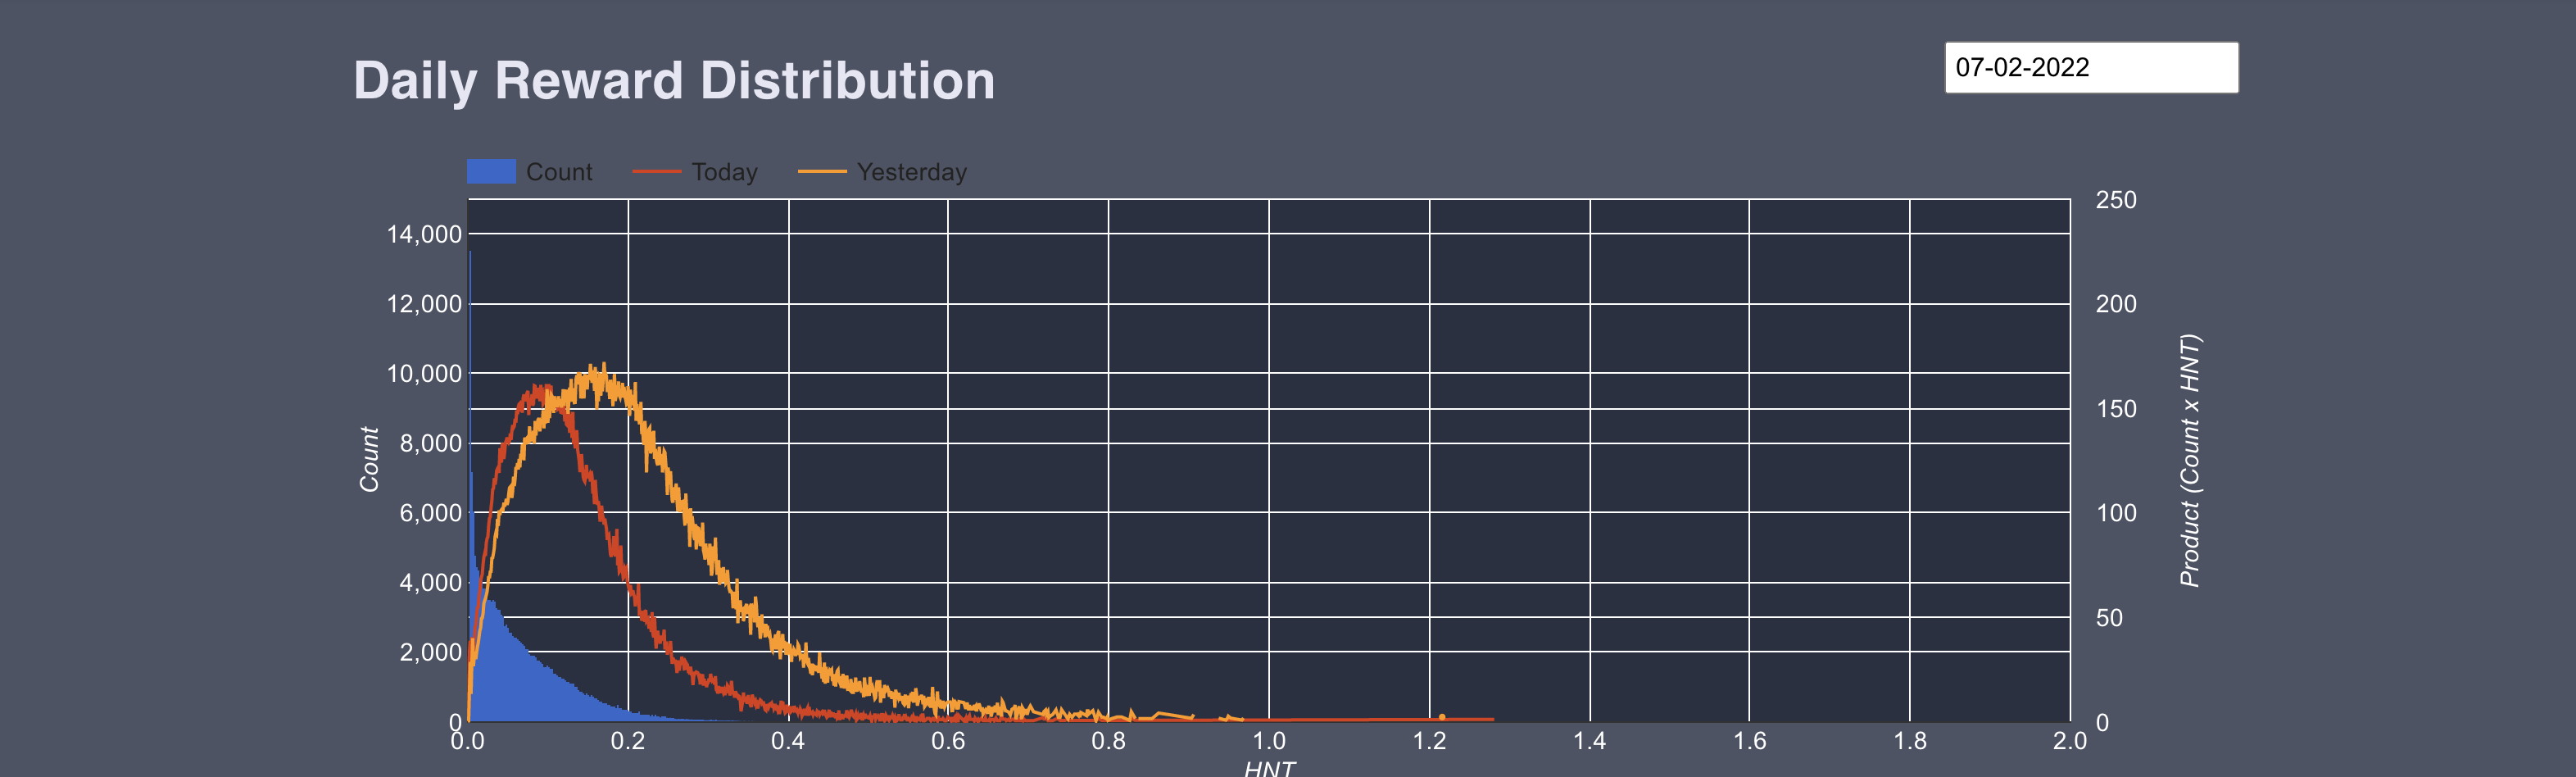
The blue area is the number of hotspots at each point. As you can see if you click through the days, MOST hotspots make .4 or less per day.
The left side Y‑axis is the number of Hotspots in each “group”, the right side Y‑axis is the total amount of HNT each “group” of Hotspots made, and the bottom is how much HNT each individual Hotspot made.
A “group” of Hotspots is all the Hotspots that made the same amount, say .46915 HNT that day.
Now let’s focus back on the next thing that makes sense for your average Hotspot owner, which is how many Hotspots are actually active on the Network. This was surprising to me; at any one time, about 30% of all Hotspots are offline! Dave says he’s been watching that stat for a while, and it’s stayed reasonably constant throughout the growth of the network.
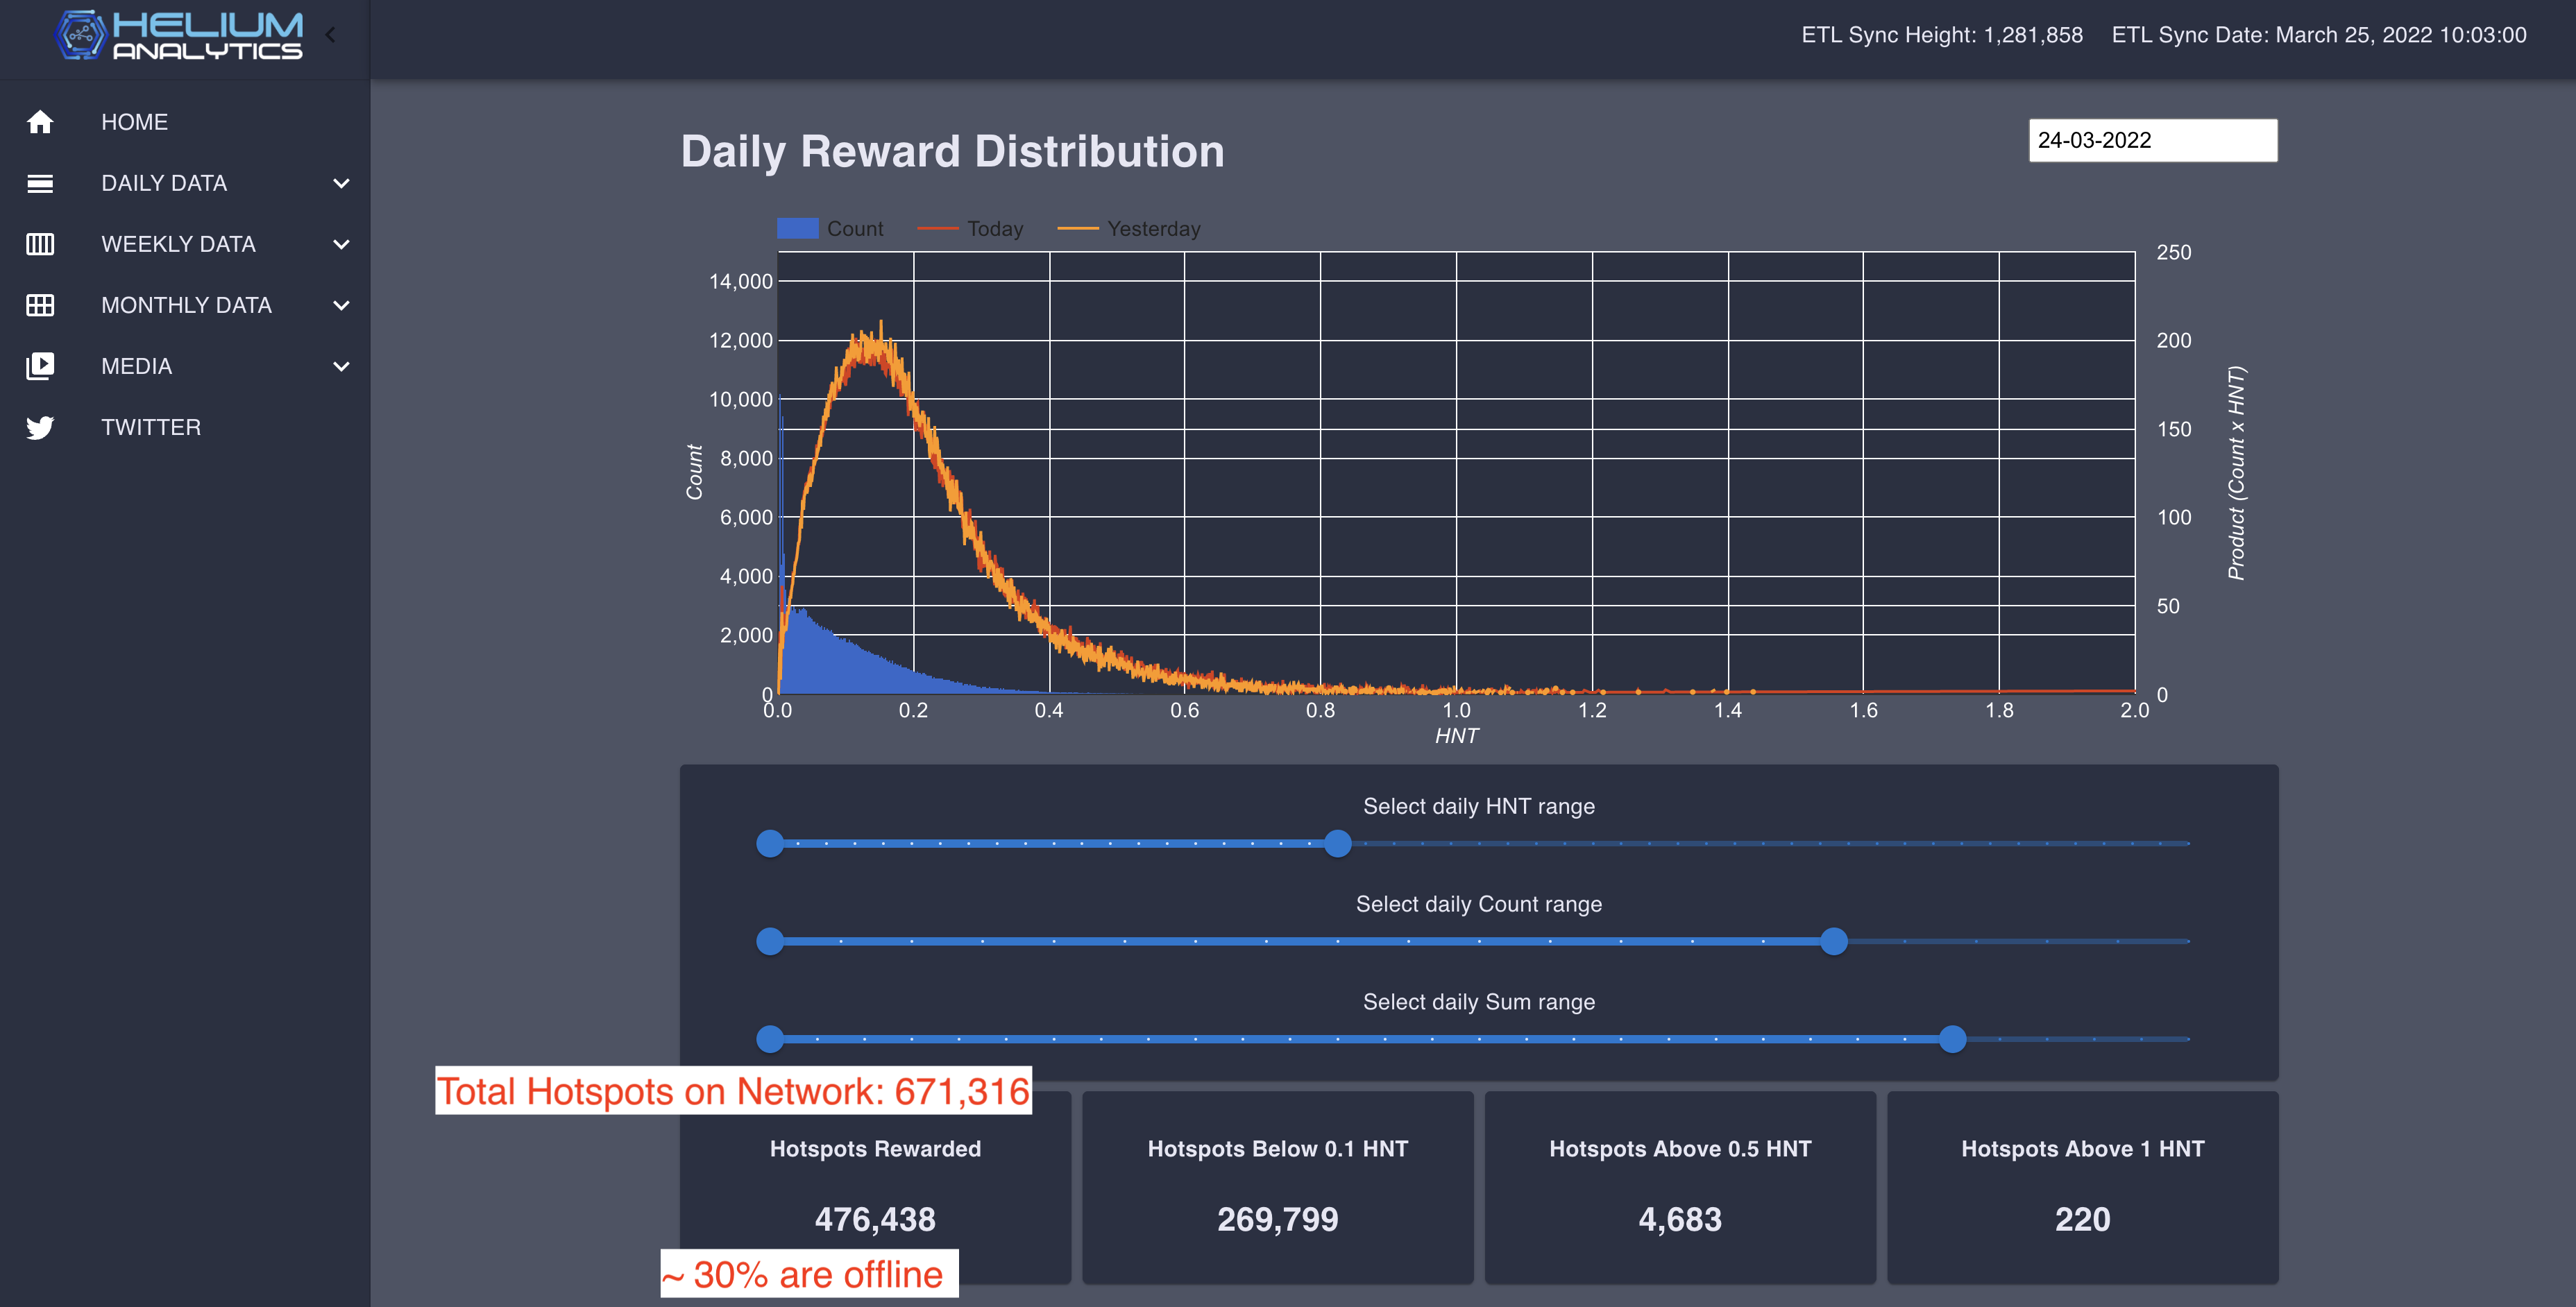
Now, WHY 30% of Hotspots are offline at any one time is a mystery to me, though I’ve heard lots of potentially true explanations. My takeaway as a Hotspot owner who is interested in earnings is that it’s fine for those of us online; we don’t have to split such thin slices of pie. 🙂
The last thing to dig into is the Challenge Summary data, and while you can dig in REEEAL deep, I stop right at the top, looking at the Average Challenges (that’s per day) and the PoC interval (this is how often an average Hotspot will Beacon). In this case, 544 minutes equal about every 9 hours. Now, that’s a rough calc, but close enough for me to use.
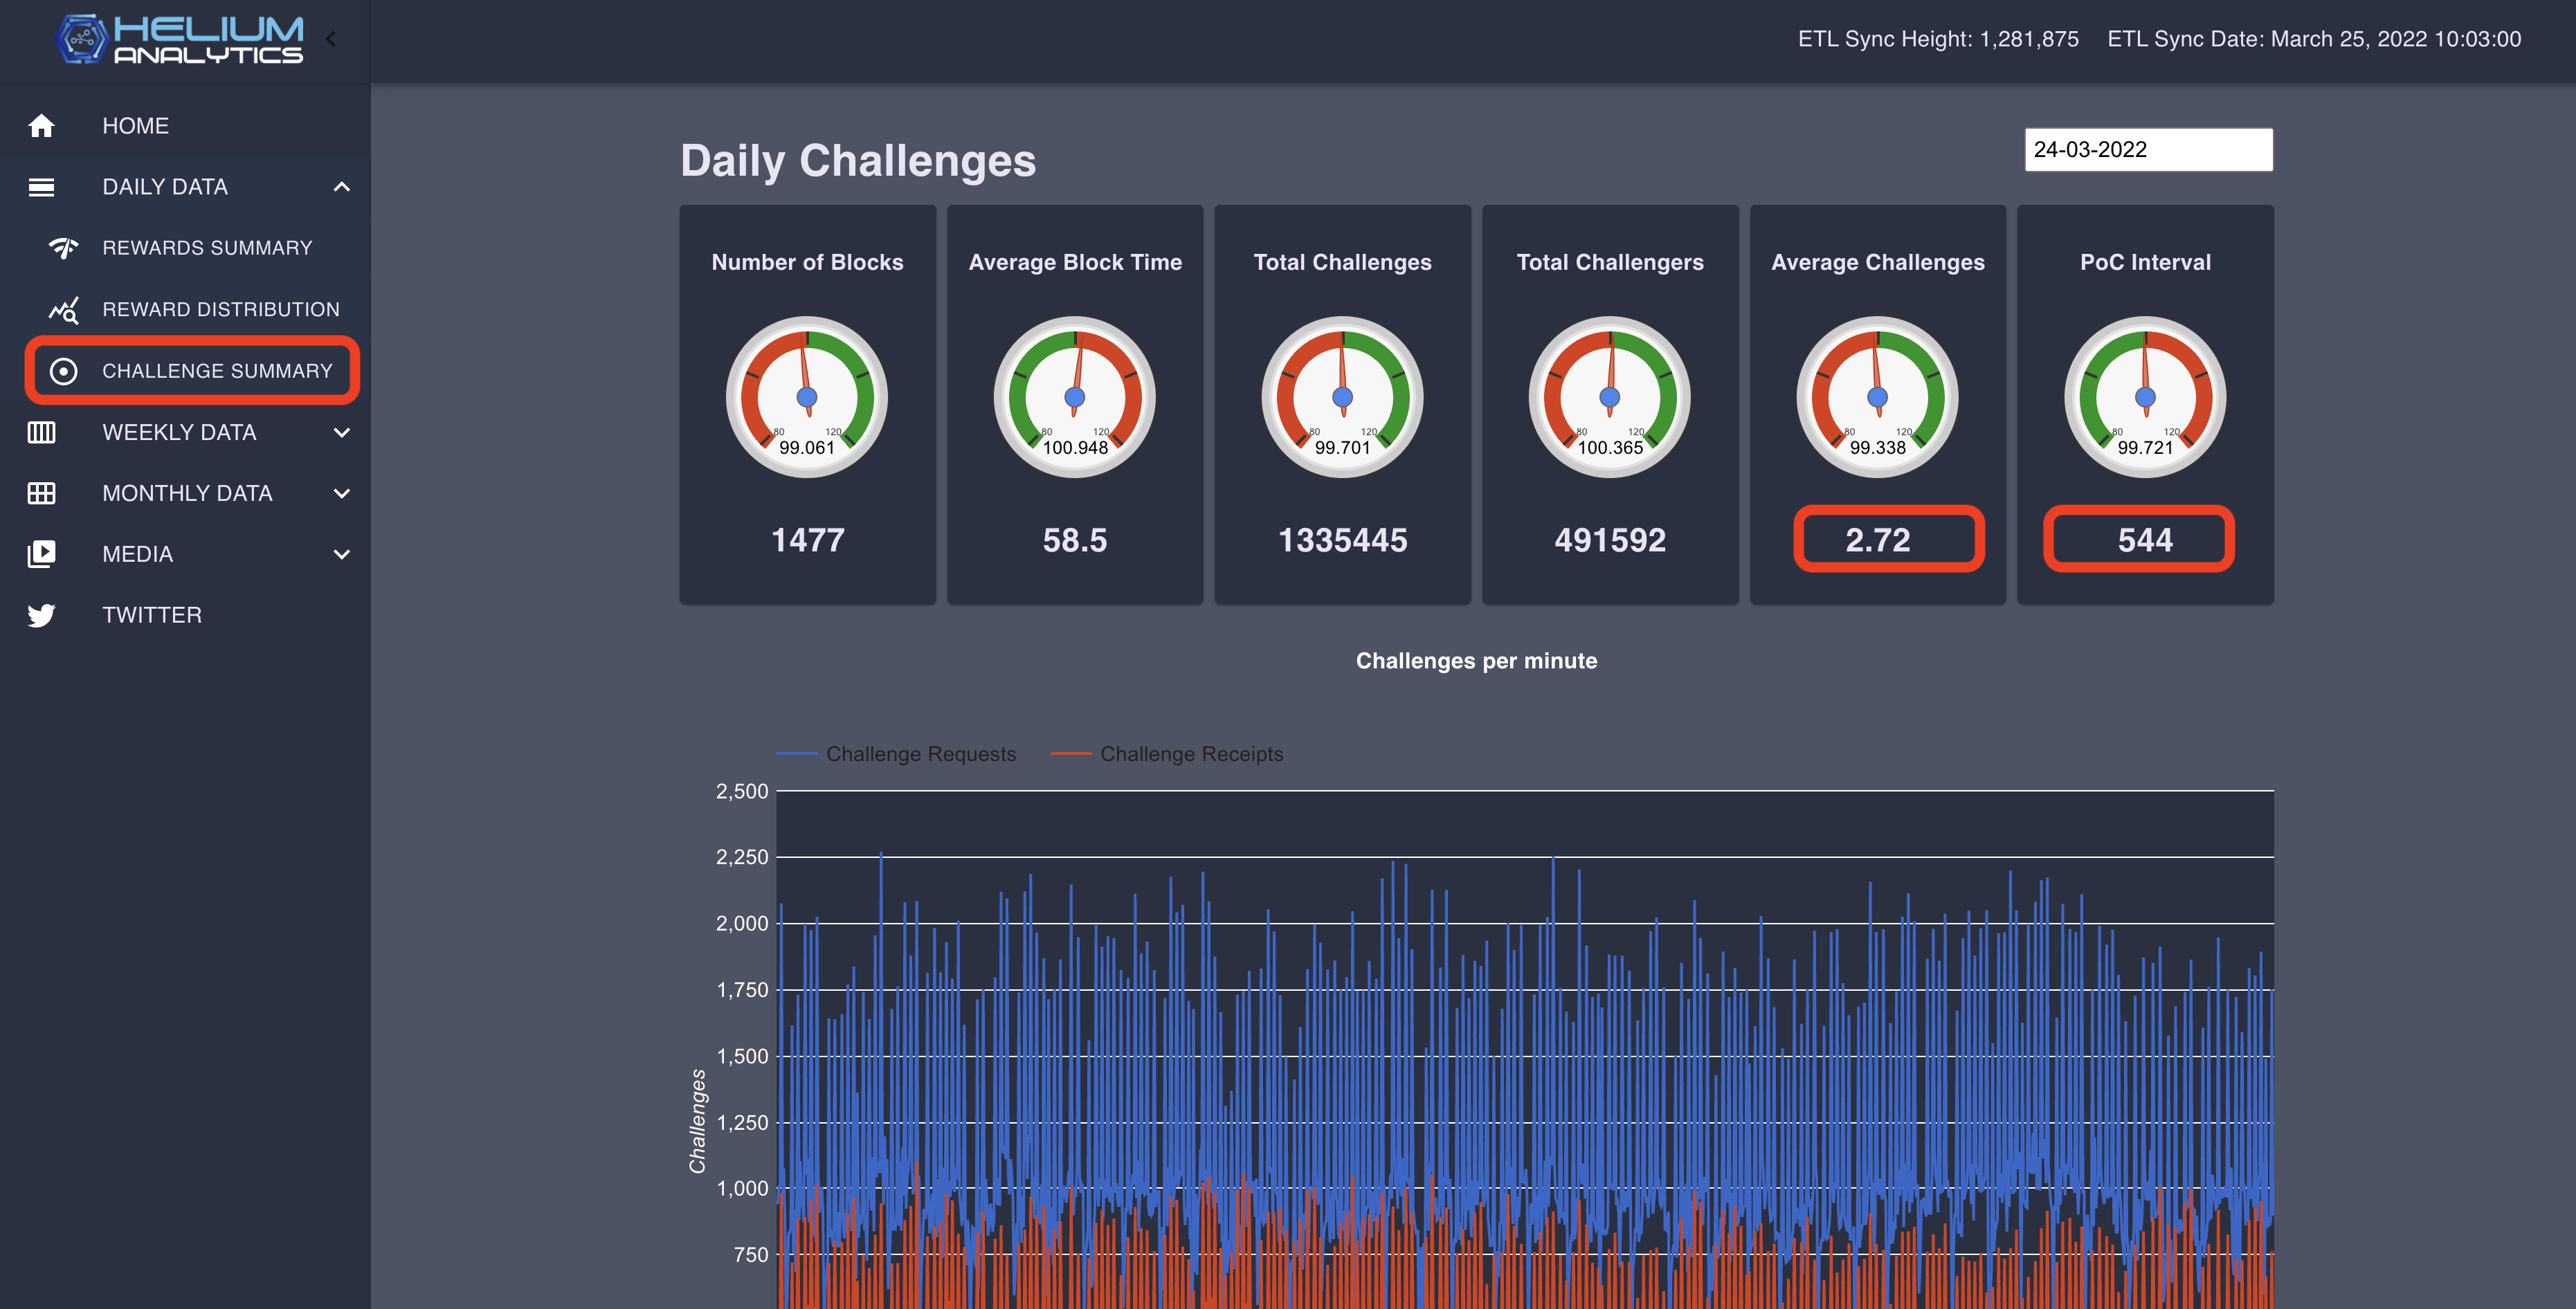
One thing to note here is that the PoC interval can be changed on the blockchain. The Helium team will do this in the short-term future just to keep the blockchain from getting too congested while we still have “full fat” Hotspots on it. When this was written (the morning of March 25th, 2022), the interval was 475.
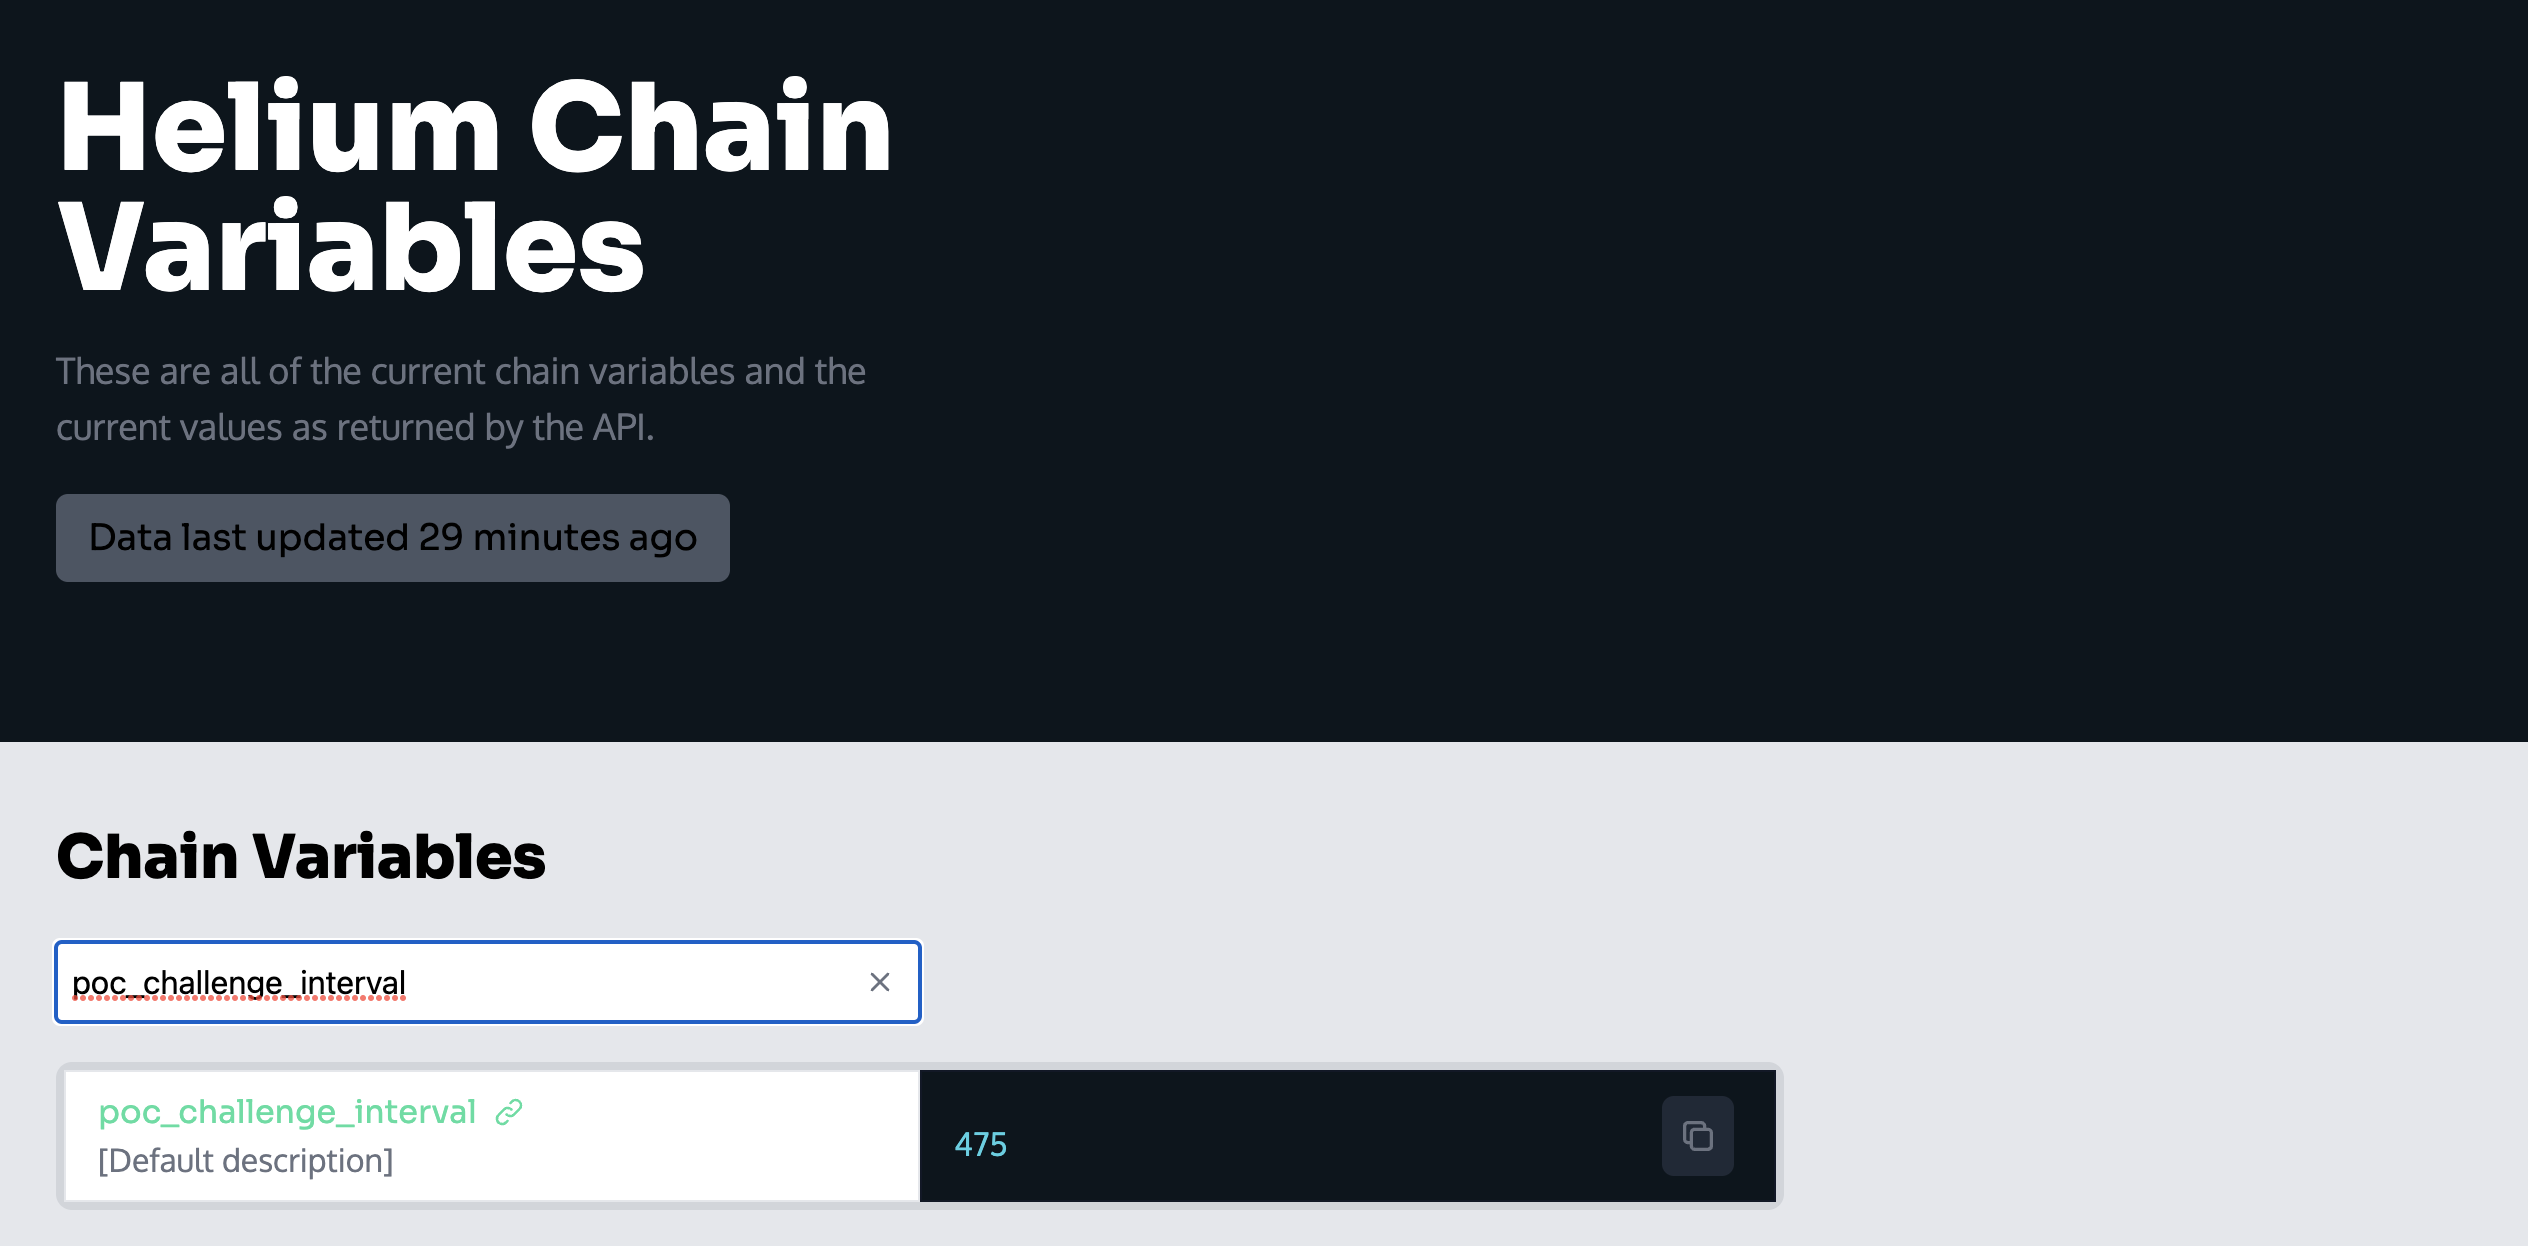
A few hours later, that interval had changed to 950. Kind of cool to be writing a blog post right in the middle of Helium history.
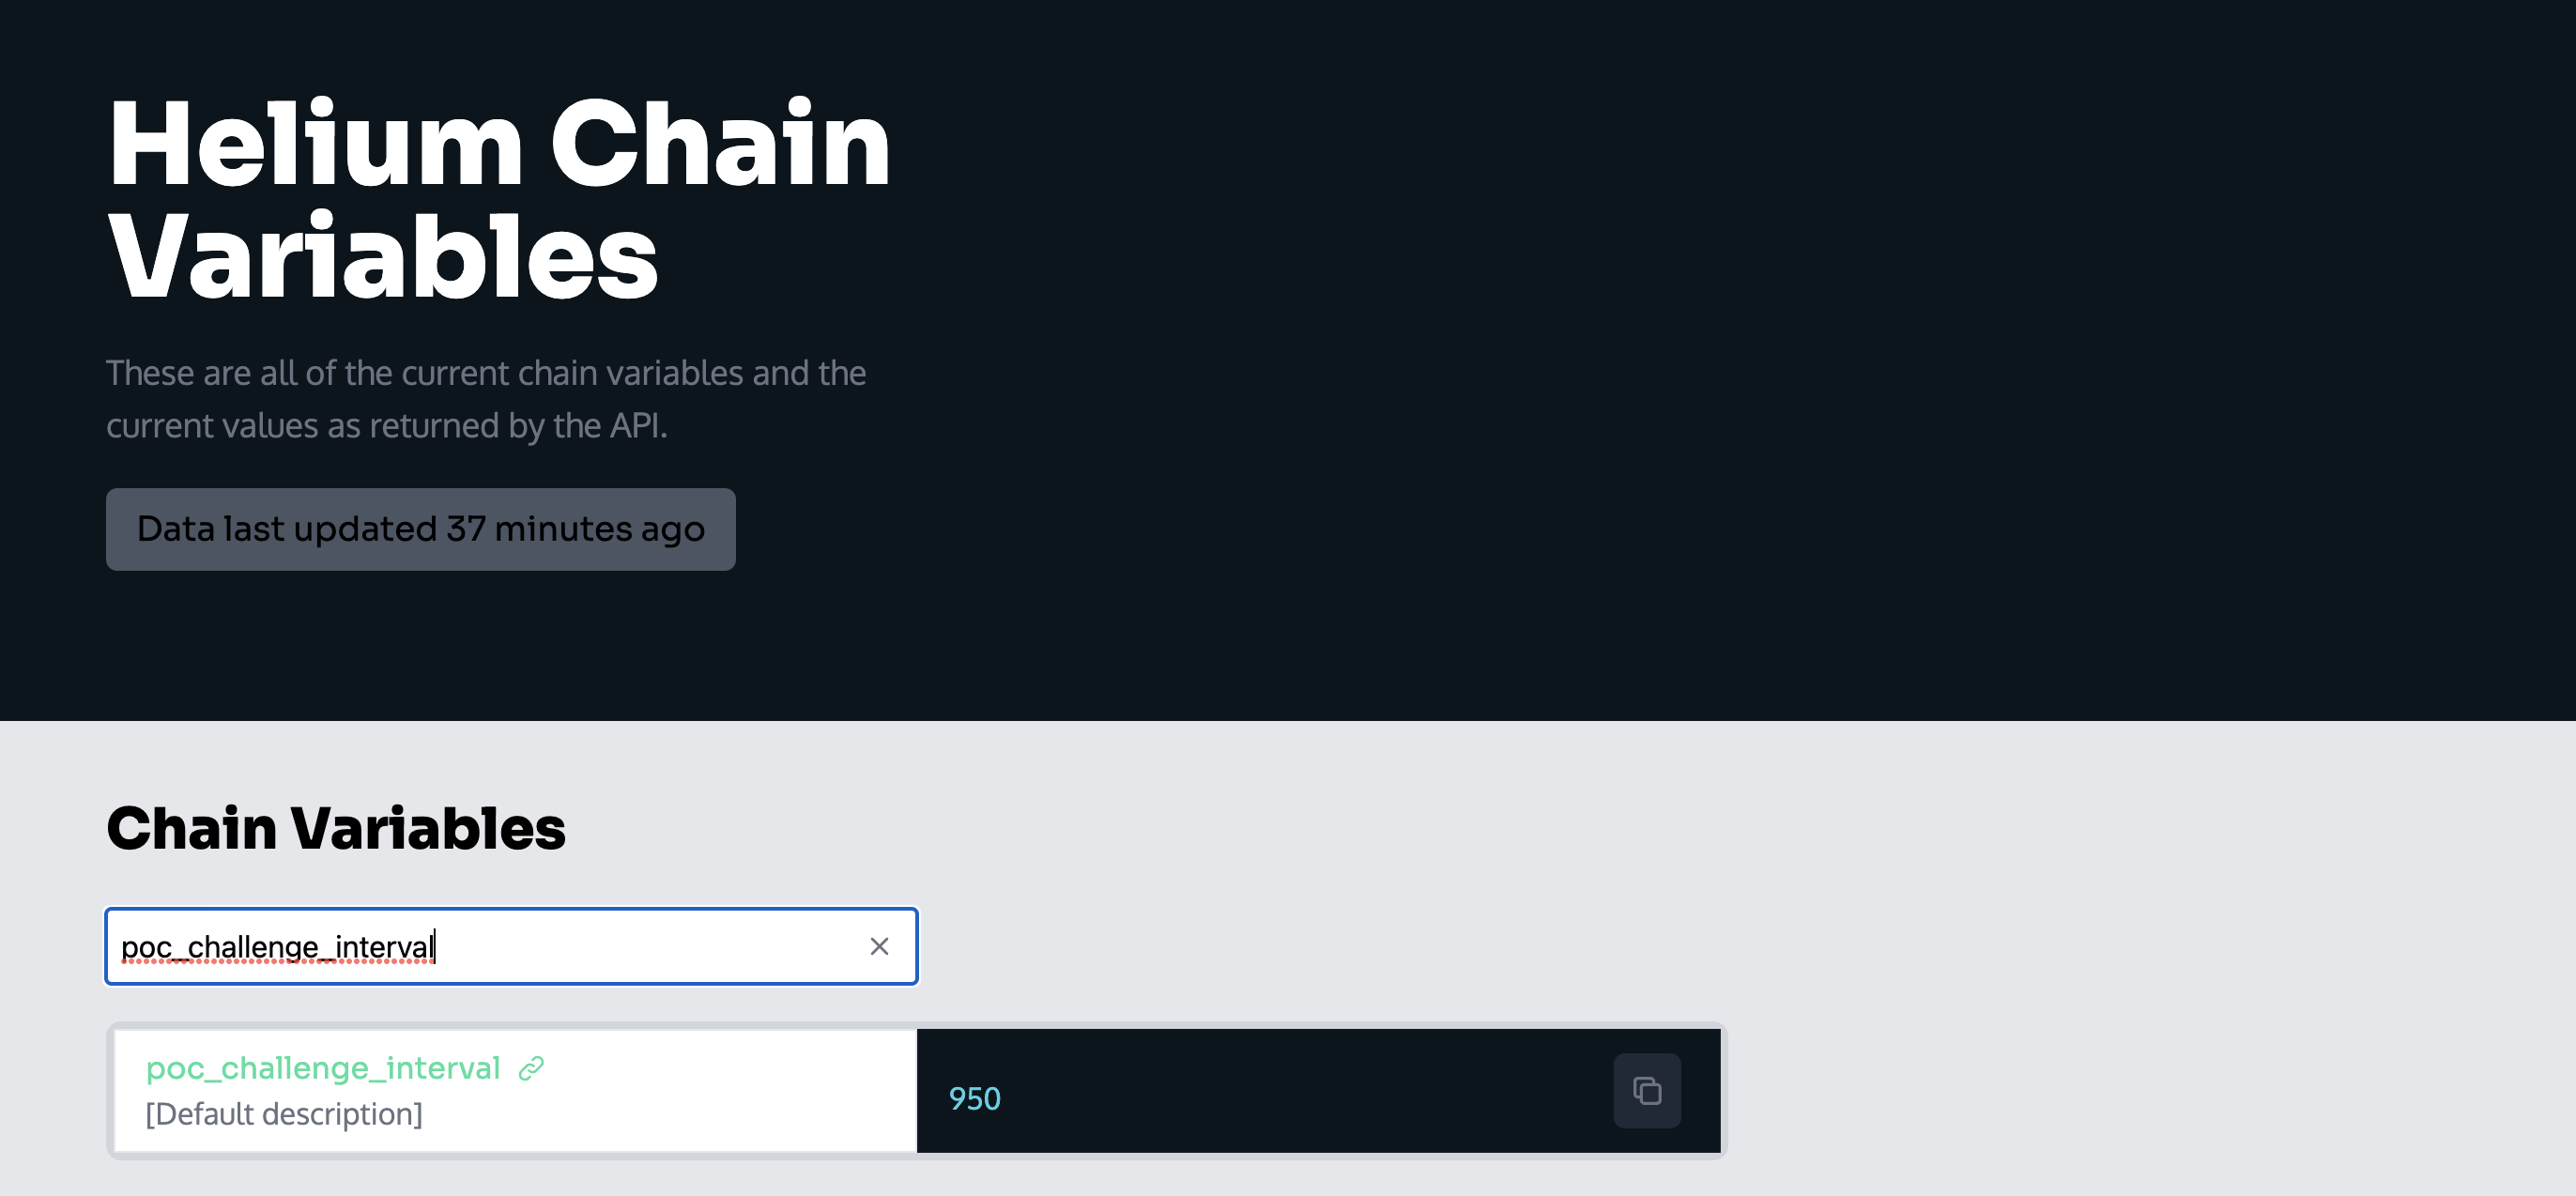
Maybe that’s a little on the nerdy side. If you want to check this, you can see any of the chain vars over here, on Helium.Plus.
You can certainly dive deeper, and we do in this video, but for now I think you’ve got the most useful basics to help determine for yourself the health of the Network. Rock on!
Hey, if you’re enjoying the content on this blog and want to either support it OR you want to join a crew of enthusiastic Helium participants, check out the courses I’ve built to help you understand Helium or consider joining the Gristle Crüe! Thanks so much for reading, and have a rad day!
Leave a Reply