Ok, so ya caught the Wingbits bug and are willing to play the game just to see how good you can get? It’s fun to mess around with the Tar1090 tool (which I’ve covered in a previous post) and see the pretty pictures, but…what about them numbers?
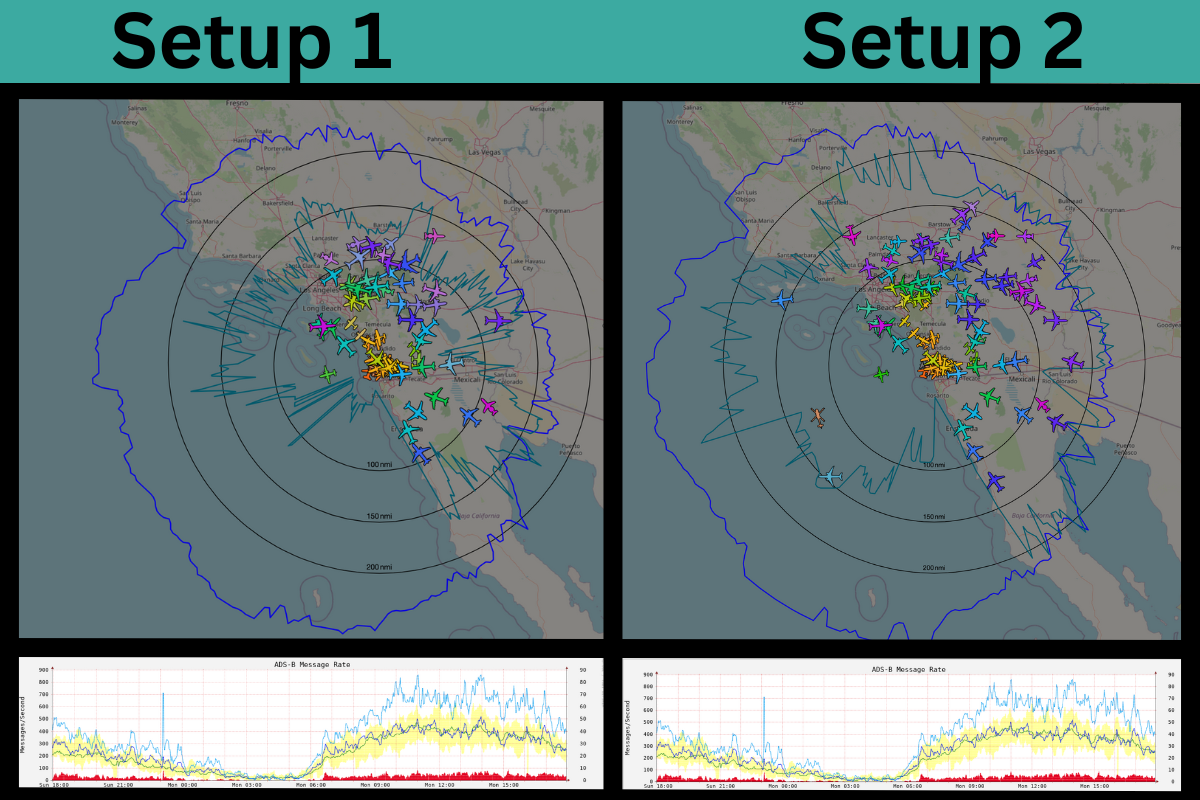
Pretty clearly here we’re seeing that Setup 2 is better than Setup 1. For right now, let’s skip the “why” and ask, “How do we KNOW this?”
I know, I know, you’re super smart and you can just look at the pictures and see that #2 is reaching out further.
Still, you might be a little geeky, and you might enjoy digging into the graphs and learning about the system so that you know for a fact not only how to move from #1 to #2, but how to measure it along the way to make sure you’re making the right moves.
So, how do we do evaluate our setup, which include the dongle, any filters or amplifiers, cable, and antenna? One way is with graphs1090.
Once you have Wingbits installed, you get to graphs1090 by going to http://192.168.xx.xxx/graphs1090/ You’ll want to replace the xx.xxx with your local IP.
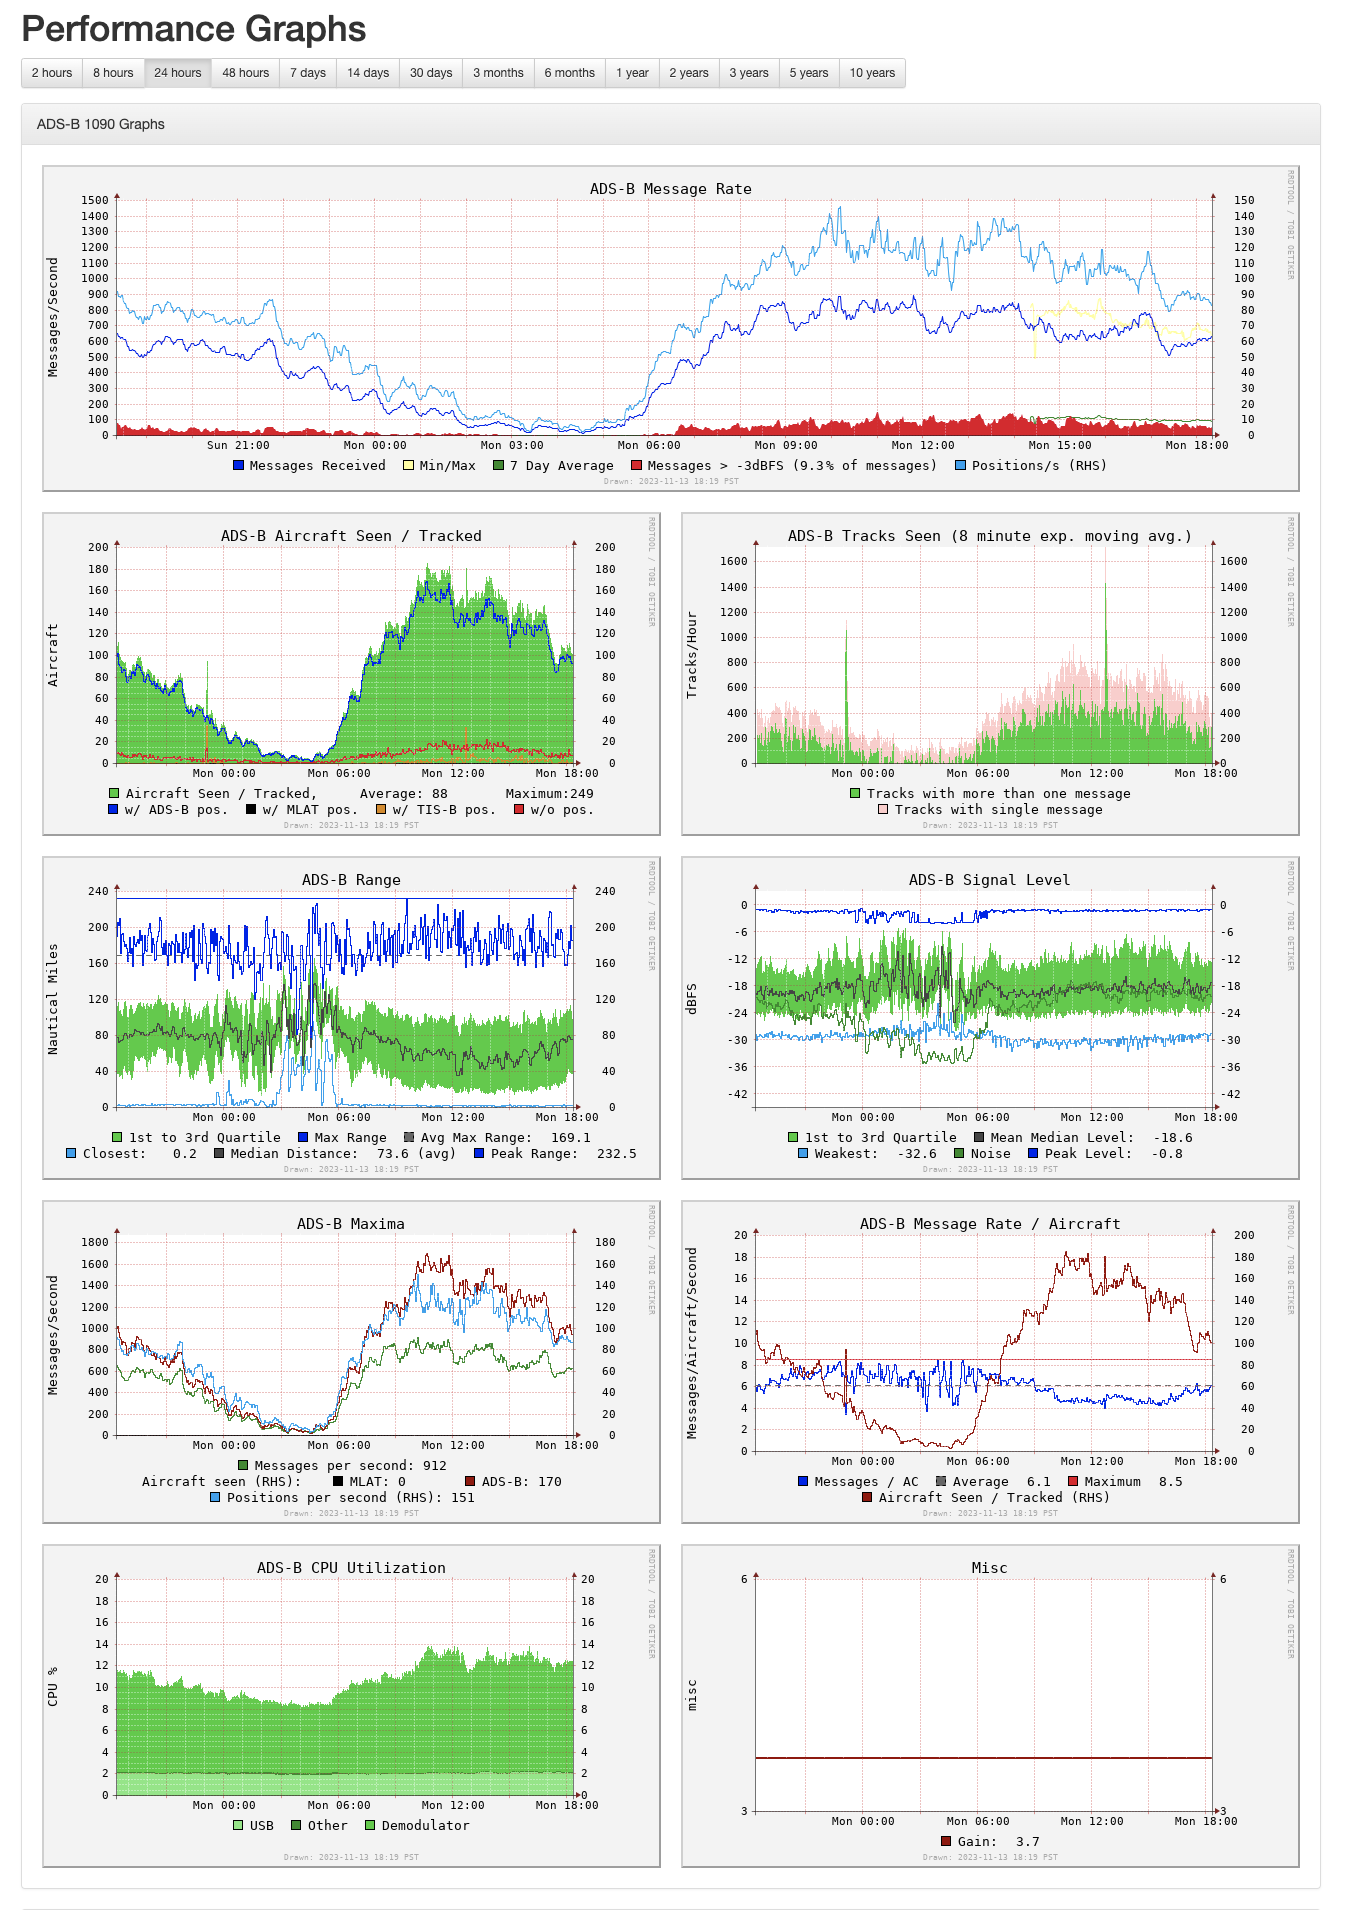
That will bring up a page that looks like this.
Officially, Wingbits calculates your rewards with this equation:
user rewards = uptime % * data provided in hex % * hex rewards * 1 Wing
The rough translation of that is “I want you to be a reliable source and cover as much ground as accurately as possible.”
For this post, we’ll focus on the second term, data provided in hex %.
Let’s start with the big picture:
For every hex out there, there are X number of available messages to collect each day. Your goal is to have a setup that collects as many of those messages as possible and submits them to Wingbits.
@acci via Discord
We have (at least) two issues when understanding how those messages count: How many messages we’re getting out of the total, and the clarity of the messages.
Think of it this way: If you receive an envelope in pristine condition, open it up and have a clearly legible letter inside, you can understand the message. If, on the other hand, you get a torn-in-half envelope with water-stained and faded writing on the letter inside that you can barely read, or the thing is on fire when you get it, well…you got the message, but it’s not really useable.
You want to get lots of envelopes that are clearly readable.
There’s one more thing when it comes to testing your setup: Some of us have an unfair advantage when it comes to testing.
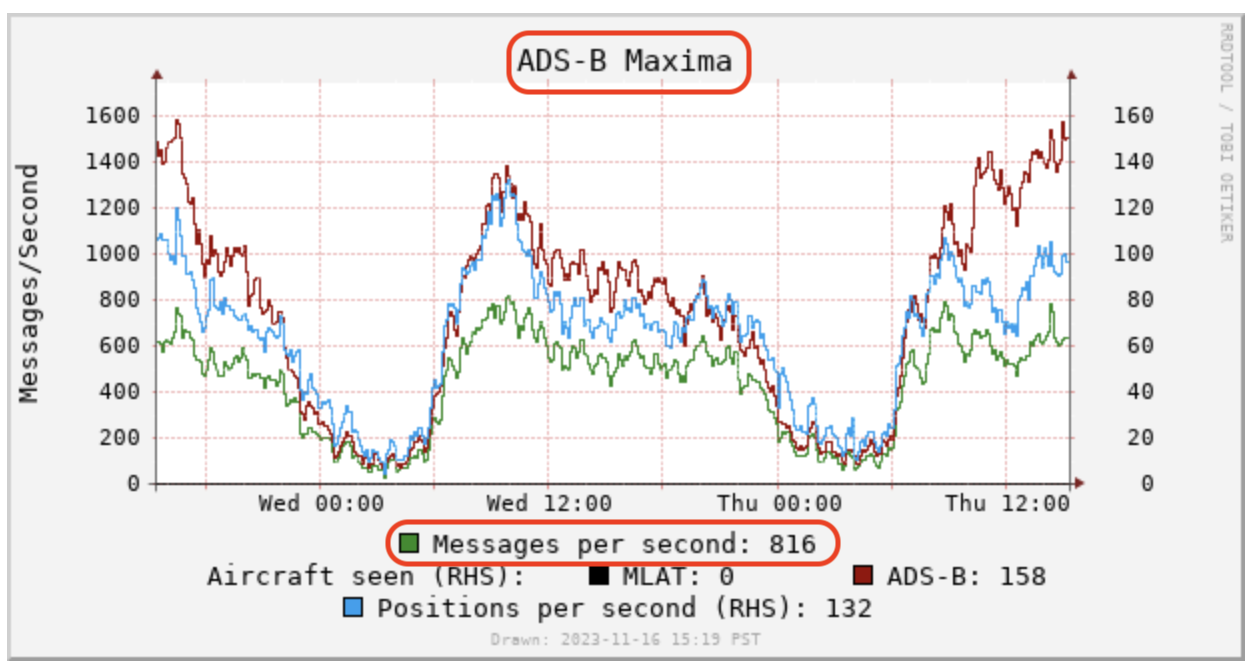
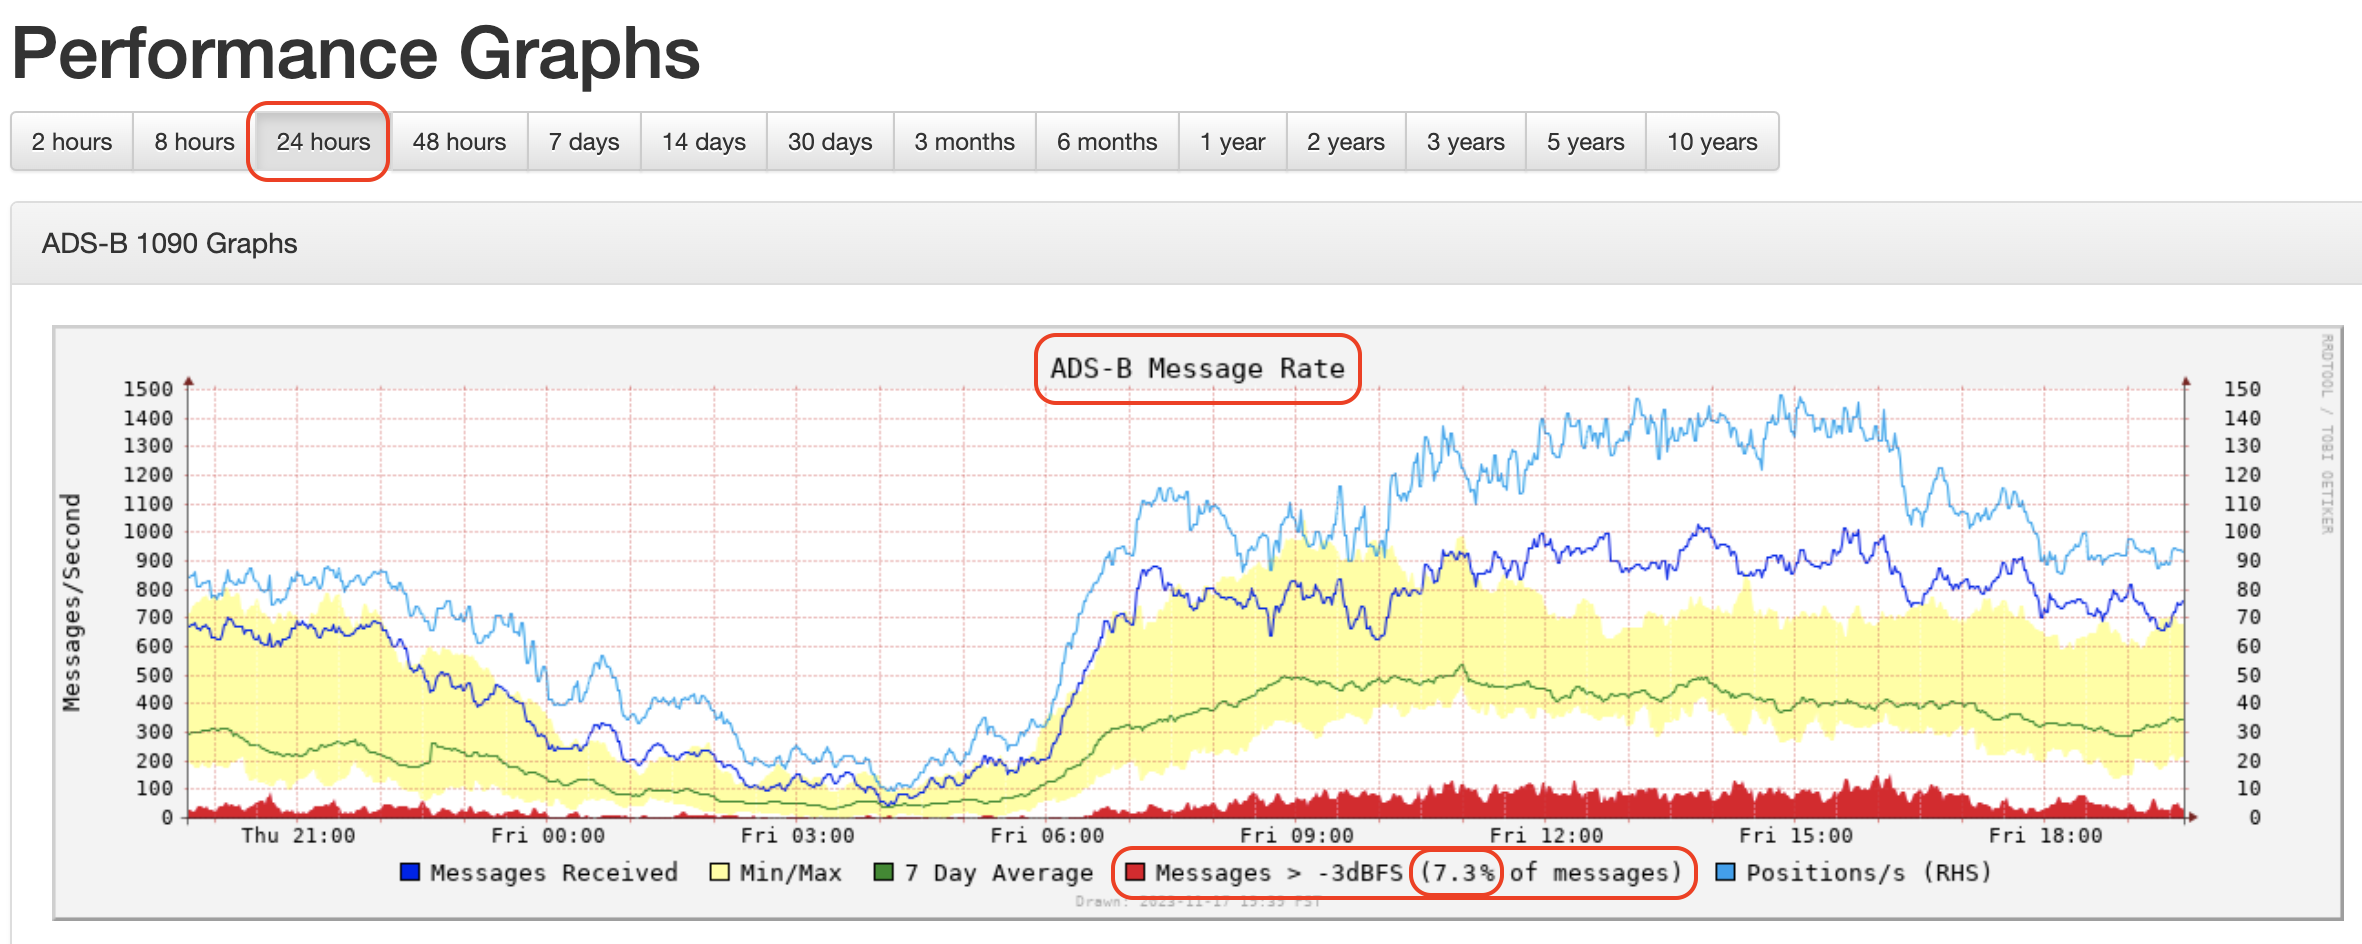
I live in San Diego, which has an international airport and is a tourist destination. We almost always have aircraft in range. I’ve got two rigs outdoors and up high. During most weekdays each can easily see over 500 message/second. You’ll see the “messages/second” down in the ADSB-Maxima box, and it’s a good measure of just how busy things can get.
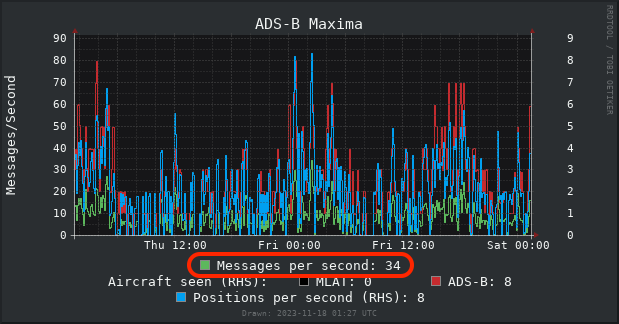
My buddy r4wk, on the other hand, lives way out back of beyond and routinely gets less than 50 messages a second. Unless he decides to pack up and live closer to a major air traffic hub, it’ll just take him longer to gather enough data to make a good decision.
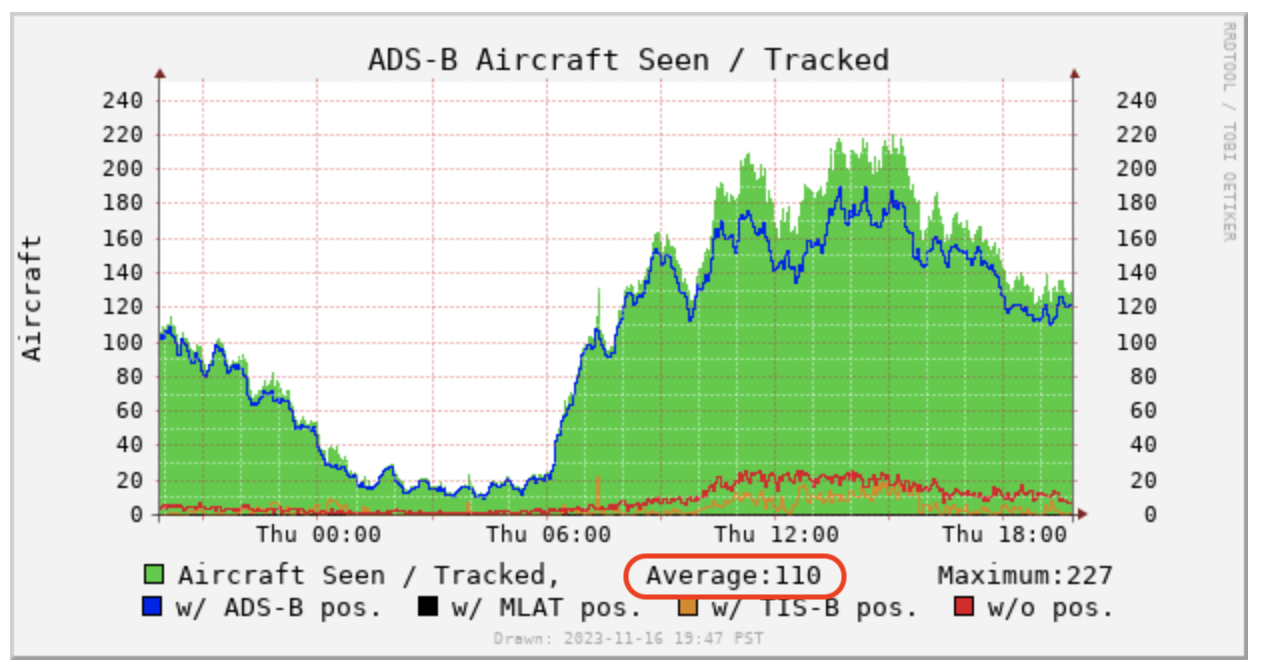
So, how much data do you need? It depends on what you’re trying to know, and how sure of the data you want to be. You can get a rough idea of how many aircraft you’re tracking by looking at the ADS‑B Aircraft Seen / Tracked graph, but keep in mind that’s not the total, just a per second amount over the course of the time period you’re looking at.
If you want to know exactly how many planes you see in a given time period, you can install and run the Unique Aircraft Tracker which you can find on my Github. By default its set for 15 minutes, but you can change it to any length of time.
gk@wingbits:~ $ python3 unique_aircraft_tracker.py
Unique aircraft in the last 15 minutes: 106
If you’re geographically lucky and can “see” a ton of plans, your testing period can generally be shorter.
If you’re like my buddy r4wk, you’ll need more time to gather the same amount of data. You’ll need to figure out what works for you, in your situation.
Ok, so with “how many planes/messages do you need” addressed, what else should you look at?
We’ll start with using graphs1090 to tune your setup a bit. I’d recommend you do this in the early evening, after a full day of messages. Set the timescale to 24 hours (at a minimum), then look at the section marked “Messages > ‑3 dBFS”. This is the first ROUGH step of gain tuning, there is a deeper dive into why dBFS isn’t the only metric to use over here.
In general, you want that to be less than 10%.
The “dB” is probably familiar to those of you who’ve deployed Helium Hotspots. This is your RSSI, or Received Signal Strength Indicator. The FS refers to the dB being measured Relative to Full Scale, where Full Scale is 0. You don’t want to reach Full Scale. 🙂 Think of Full Scale (in our envelope example before) as your envelope being on fire. Very hard to read a burning envelope.
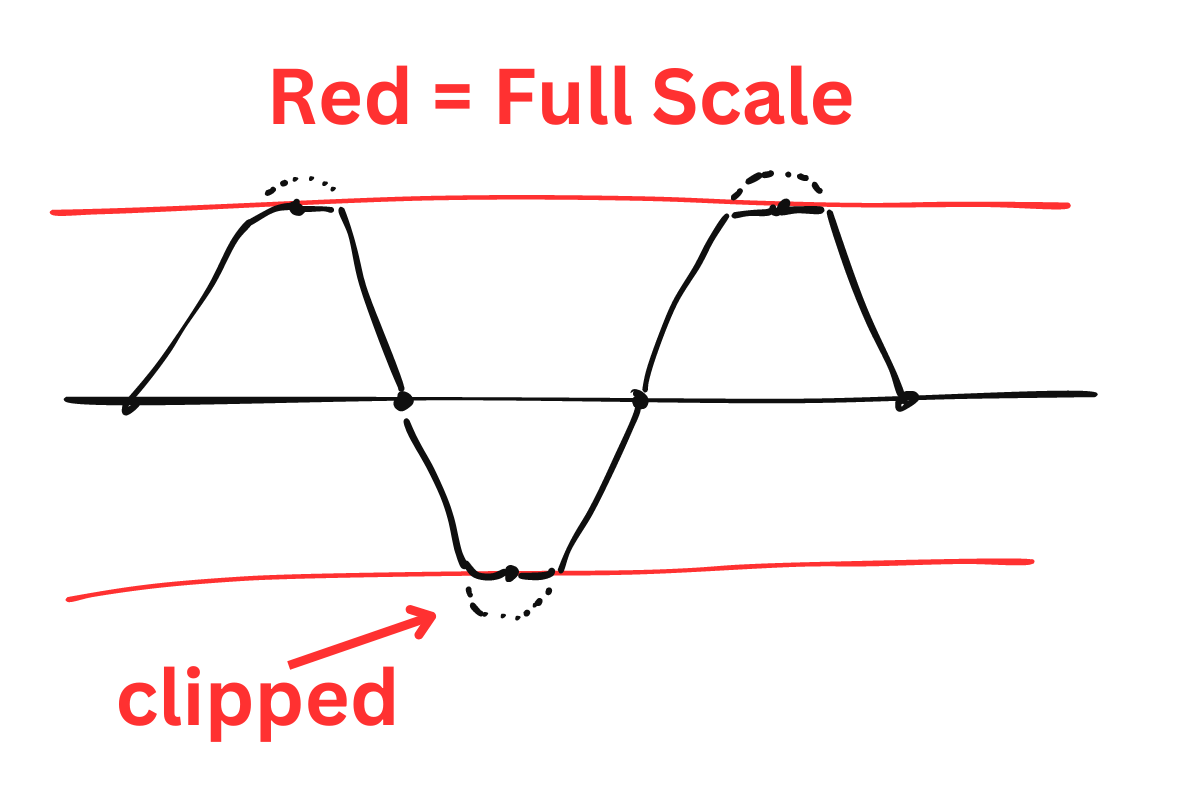
Now, you might think you just want to stay hell away from those red lines. How would you do that? By turning down your gain. Think of (and yes radio nerds, I know this isn’t exactly right) gain as volume. As you crank the volume, at some point it gets distorted and becomes difficult to hear what’s going on.
How do you tune your gain? First, there’s a way to definitely NOT do it; DON’T use the the Automatic Gain Optimization script. It won’t get you where you want to go fast enough, and it may overshoot in either direction.
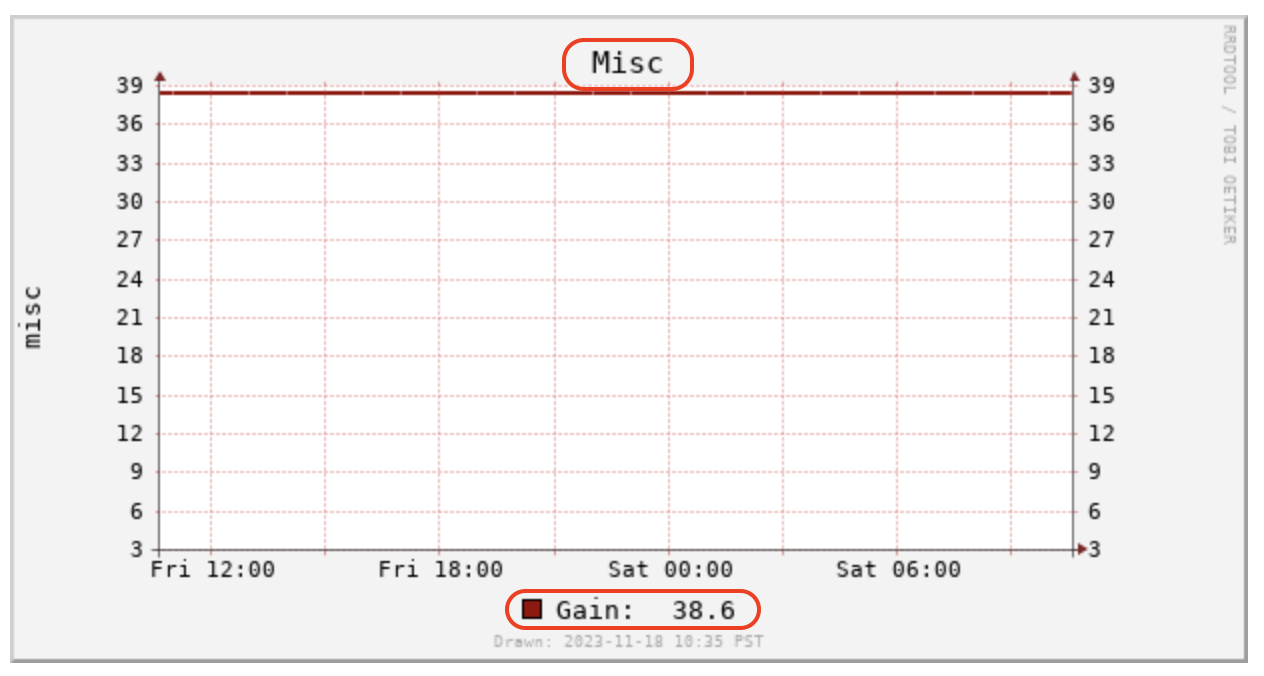
You can see your current gain in the graphs1090 section labled (oddly), “Misc”. Here, you can see my gain is set to 38.6
Changing gain is easy (and let’s be honest, it’s fun to fiddle with this!). Open up a Terminal to your Pi or whatever you’re using and type this, where “xx.x” is the gain you want.
sudo readsb-gain xx.xYour options are limited to the following. If you set something else, it’ll snap to the nearest number in the following list.
0.0 0.9 1.4 2.7 3.7 7.7 8.7 12.5 14.4 15.7 16.6 19.7 20.7 22.9 25.4 28.0 29.7 32.8 33.8 36.4 37.2 38.6 40.2 42.1 43.4 43.9 44.5 48.0 49.6 -10You CAN get around this with an external gain tuner, but for now let’s just use what you already have.
Once you’ve set your gain, you can wait a bit and watch the 1090graph tables, OR you can stay in the command line and execute this, to give you a real time gain read over a specific time period since readsb started.
grep -sh /run/{dump1090,dump1090-fa,readsb}/stats.json -e '' | jq '.total.local | ((.accepted | add), .strong_signals, .signal, .noise)' | xargs -n4 echo | awk '{printf "\nPercentage of strong messages: %.3f\nSignal: %.1f\nNoise: %.1f\n", $(2) * 100 / $(1), $(3), $(4)}'That will return something like this:
Percentage of strong messages: 6.657
Signal: -10.0
Noise: -22.3
In that command, you can change the word total in .total.local to one of the following to read the last 1 minute, 5 minutes, or 15 minutes.
last1min
last5min
last15min
I’d suggest at least 15 minutes, but part of the joy of this whole thing is mucking about with it and deciding what works for you.
Now that you’ve set your gain, let’s make sure you didn’t set it too high (or too low).
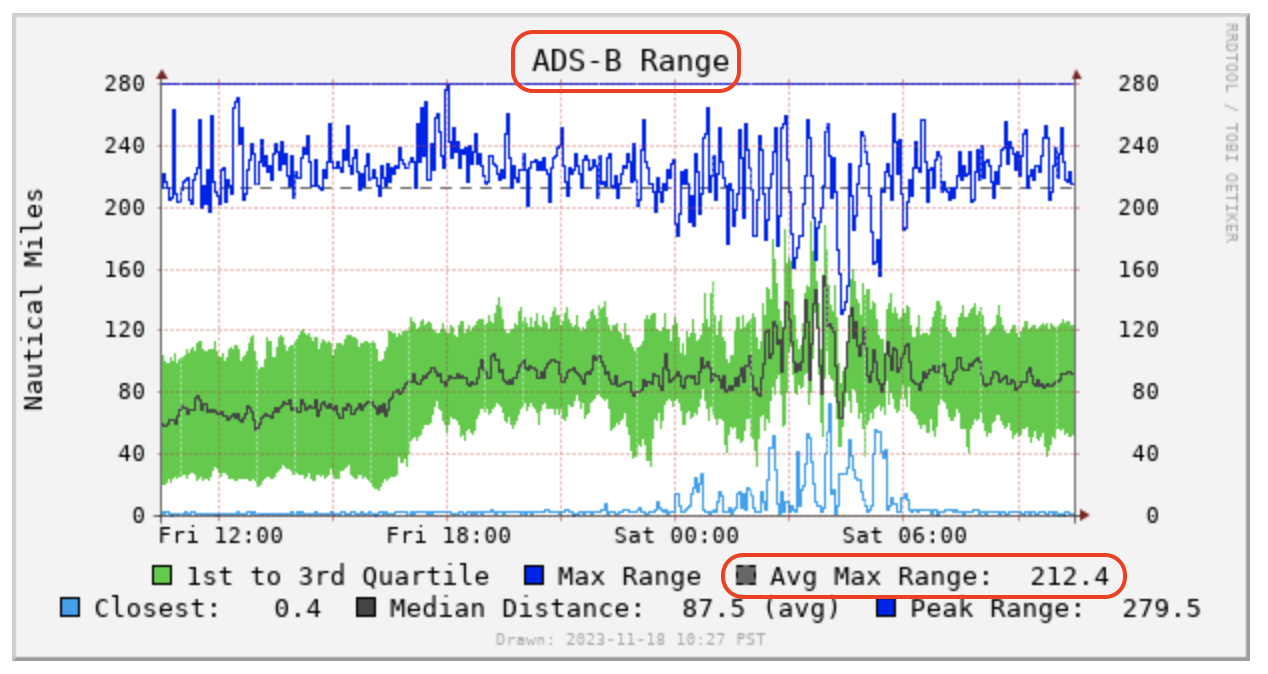
We’ll use the ADS‑B Range graph to help us confirm that we’re still getting enough range even as we turn down our gain.
You can also run the Unique Aircraft Tracker Python script from above, changing your time period to match what you’re testing.
Here in San Diego on a weekday, I’d be pretty comfortable running 15 minute tests after I changed something on the rig. That could be the gain, or a different antenna, or a new filter, etc.
At this point (mid-November 2023) it’s difficult to say what to aim for with Wingbits. It’s not clear if we want max range, or a low amount of “too hot” messages, or the maximum number of aircraft. My *guess* is that you’ll be best off striking a balance with all three. Remember, that’s just a guess; the official goals haven’t been released.
Going Further — ADS‑B Analysis With Dirk Beer
Ok, let’s say you want even more number‑y stuff. Where might you turn? Why, my good friend and fellow San Diegan Dirk Beer! Dirk has written an additional Python script to help assess your range.
It does this by making an assumption; the aircraft that just transmitted via ADS‑B will do again. If you received the first transmission, you should receive the next. If you don’t receive the next, it’s not because the aircraft ceased to exist, it’s that your rig no longer has the range to adequately hear it.
You can find Dirk’s scripts along with his well written instructions over on his Github.
Running them will give you a graph like this:
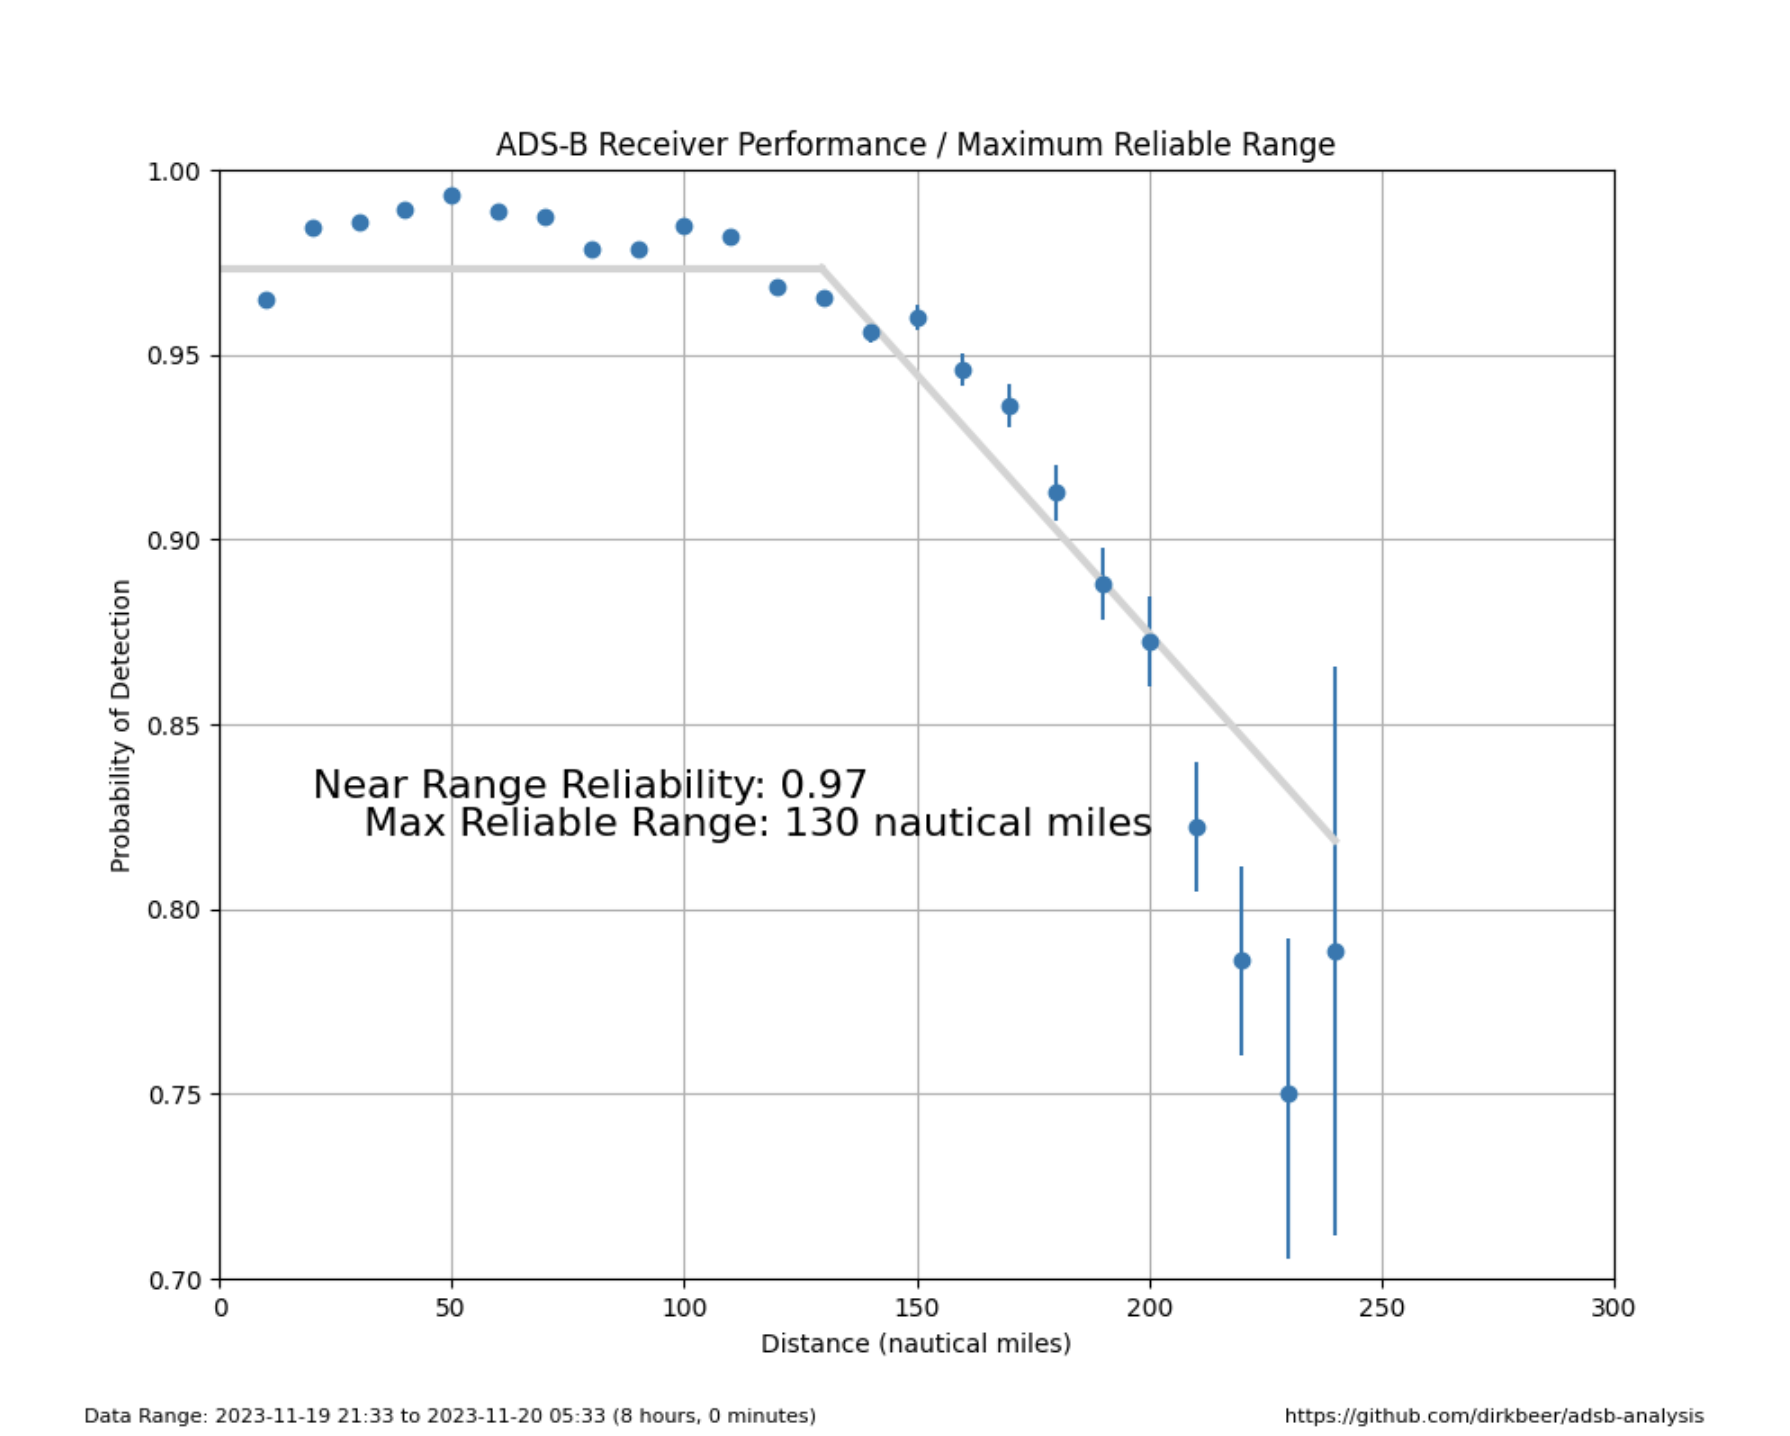
You can use this to act as a check the range reported with my Python scripts, then continue to adjust your gain (or other aspects) accordingly. Dirk has been working a bunch on this lately, and you may find that you’ll get most of the information you need just from his script.
Whatever you do, have fun with Wingbits, enjoy learning about new tools and ways to use ’em, and have a blast! Huge thanks to @acci, @grayhatguy, @dirkbeer, and @r4wk for the help with this post; this community is so rad!
Thanks a ton for reading through this, hopefully you found it helpful.
If you’d like to go deeper into more projects, consider joining the Gristle Crüe, a paid membership I maintain for people serious about learning in the DePIN space. We cover lots of projects as well as entrepreneurial opportunities.
If that’s not quite your jam but you’d still like to support, check out a weekly public show I run called State of the Networks. It’s focused more on publicly available news and updates in the wider DePIN space.
Leave a Reply